Immigrants from Germany vs Argentinean Unemployment Among Youth under 25 years
COMPARE
Immigrants from Germany
Argentinean
Unemployment Among Youth under 25 years
Unemployment Among Youth under 25 years Comparison
Immigrants from Germany
Argentineans
11.5%
UNEMPLOYMENT AMONG YOUTH UNDER 25 YEARS
65.9/ 100
METRIC RATING
156th/ 347
METRIC RANK
11.5%
UNEMPLOYMENT AMONG YOUTH UNDER 25 YEARS
73.0/ 100
METRIC RATING
145th/ 347
METRIC RANK
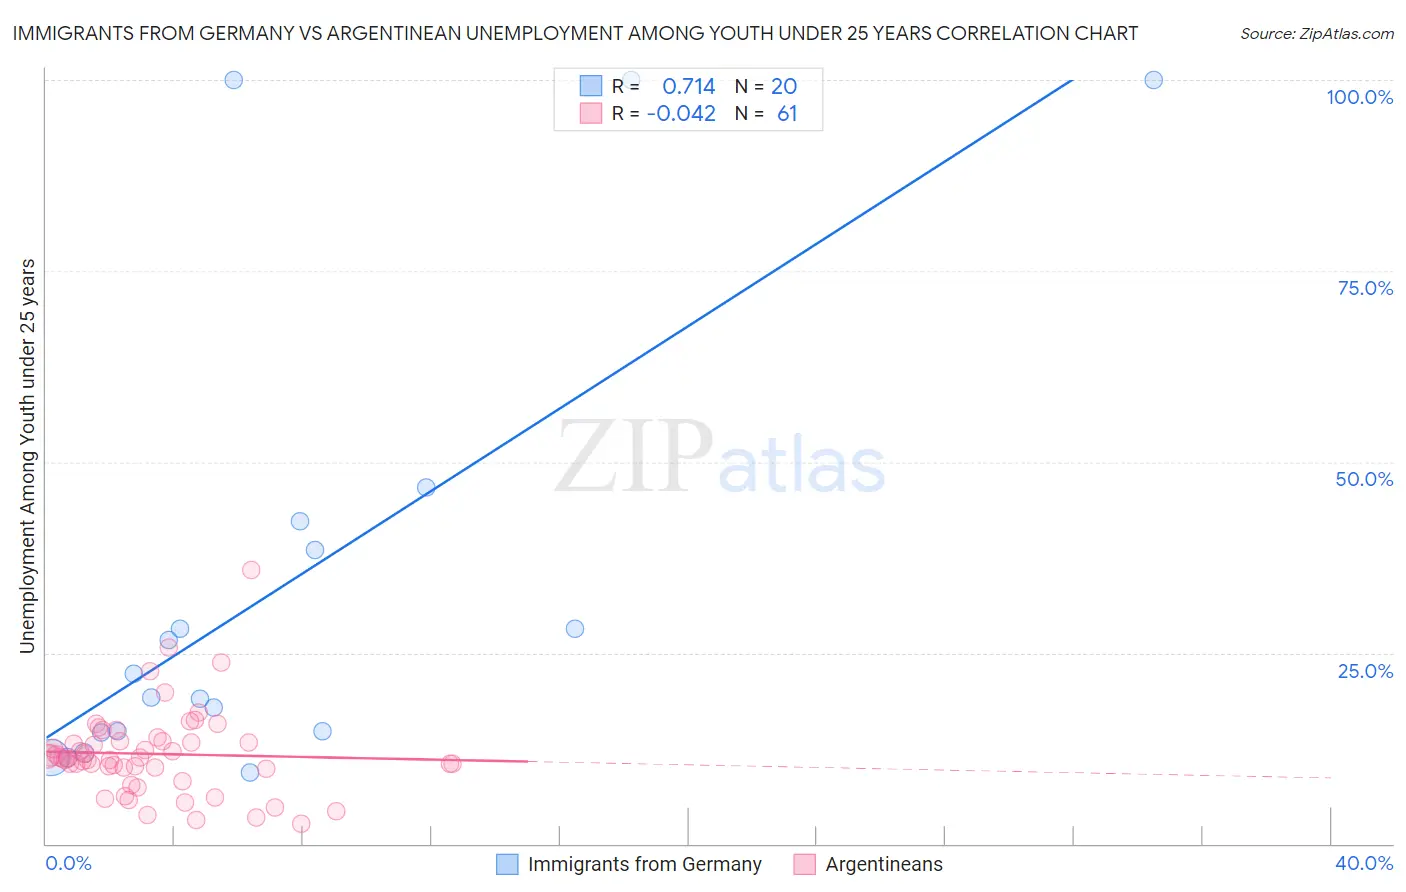
Immigrants from Germany vs Argentinean Unemployment Among Youth under 25 years Correlation Chart
The statistical analysis conducted on geographies consisting of 454,799,121 people shows a strong positive correlation between the proportion of Immigrants from Germany and unemployment rate among youth under the age of 25 in the United States with a correlation coefficient (R) of 0.714 and weighted average of 11.5%. Similarly, the statistical analysis conducted on geographies consisting of 295,287,536 people shows no correlation between the proportion of Argentineans and unemployment rate among youth under the age of 25 in the United States with a correlation coefficient (R) of -0.042 and weighted average of 11.5%, a difference of 0.35%.
Unemployment Among Youth under 25 years Correlation Summary
| Measurement | Immigrants from Germany | Argentinean |
| Minimum | 9.3% | 2.7% |
| Maximum | 100.0% | 35.8% |
| Range | 90.7% | 33.1% |
| Mean | 33.8% | 11.8% |
| Median | 20.7% | 11.1% |
| Interquartile 25% (IQ1) | 14.7% | 9.9% |
| Interquartile 75% (IQ3) | 40.3% | 13.5% |
| Interquartile Range (IQR) | 25.7% | 3.5% |
| Standard Deviation (Sample) | 30.4% | 5.6% |
| Standard Deviation (Population) | 29.6% | 5.6% |
Demographics Similar to Immigrants from Germany and Argentineans by Unemployment Among Youth under 25 years
In terms of unemployment among youth under 25 years, the demographic groups most similar to Immigrants from Germany are Immigrants from Romania (11.5%, a difference of 0.020%), Indian (Asian) (11.5%, a difference of 0.030%), Immigrants from Asia (11.5%, a difference of 0.040%), Immigrants from Turkey (11.5%, a difference of 0.050%), and Immigrants from Western Europe (11.5%, a difference of 0.050%). Similarly, the demographic groups most similar to Argentineans are Brazilian (11.5%, a difference of 0.020%), Laotian (11.5%, a difference of 0.030%), Immigrants from Northern Europe (11.5%, a difference of 0.050%), Immigrants from Cambodia (11.5%, a difference of 0.060%), and Immigrants from Brazil (11.5%, a difference of 0.070%).
| Demographics | Rating | Rank | Unemployment Among Youth under 25 years |
| Immigrants | Belgium | 77.5 /100 | #140 | Good 11.5% |
| Immigrants | Uruguay | 76.1 /100 | #141 | Good 11.5% |
| Immigrants | Korea | 75.1 /100 | #142 | Good 11.5% |
| Immigrants | Uganda | 74.5 /100 | #143 | Good 11.5% |
| Immigrants | Brazil | 74.3 /100 | #144 | Good 11.5% |
| Argentineans | 73.0 /100 | #145 | Good 11.5% |
| Brazilians | 72.5 /100 | #146 | Good 11.5% |
| Laotians | 72.4 /100 | #147 | Good 11.5% |
| Immigrants | Northern Europe | 72.1 /100 | #148 | Good 11.5% |
| Immigrants | Cambodia | 71.8 /100 | #149 | Good 11.5% |
| Immigrants | Switzerland | 71.6 /100 | #150 | Good 11.5% |
| Uruguayans | 70.4 /100 | #151 | Good 11.5% |
| Iraqis | 68.3 /100 | #152 | Good 11.5% |
| Immigrants | Czechoslovakia | 67.1 /100 | #153 | Good 11.5% |
| Immigrants | Asia | 66.7 /100 | #154 | Good 11.5% |
| Immigrants | Romania | 66.3 /100 | #155 | Good 11.5% |
| Immigrants | Germany | 65.9 /100 | #156 | Good 11.5% |
| Indians (Asian) | 65.1 /100 | #157 | Good 11.5% |
| Immigrants | Turkey | 64.8 /100 | #158 | Good 11.5% |
| Immigrants | Western Europe | 64.7 /100 | #159 | Good 11.5% |
| Immigrants | Eastern Asia | 64.5 /100 | #160 | Good 11.5% |