Immigrants from France vs Canadian Unemployment Among Ages 16 to 19 years
COMPARE
Immigrants from France
Canadian
Unemployment Among Ages 16 to 19 years
Unemployment Among Ages 16 to 19 years Comparison
Immigrants from France
Canadians
17.5%
UNEMPLOYMENT AMONG AGES 16 TO 19 YEARS
54.9/ 100
METRIC RATING
167th/ 347
METRIC RANK
16.9%
UNEMPLOYMENT AMONG AGES 16 TO 19 YEARS
96.7/ 100
METRIC RATING
89th/ 347
METRIC RANK
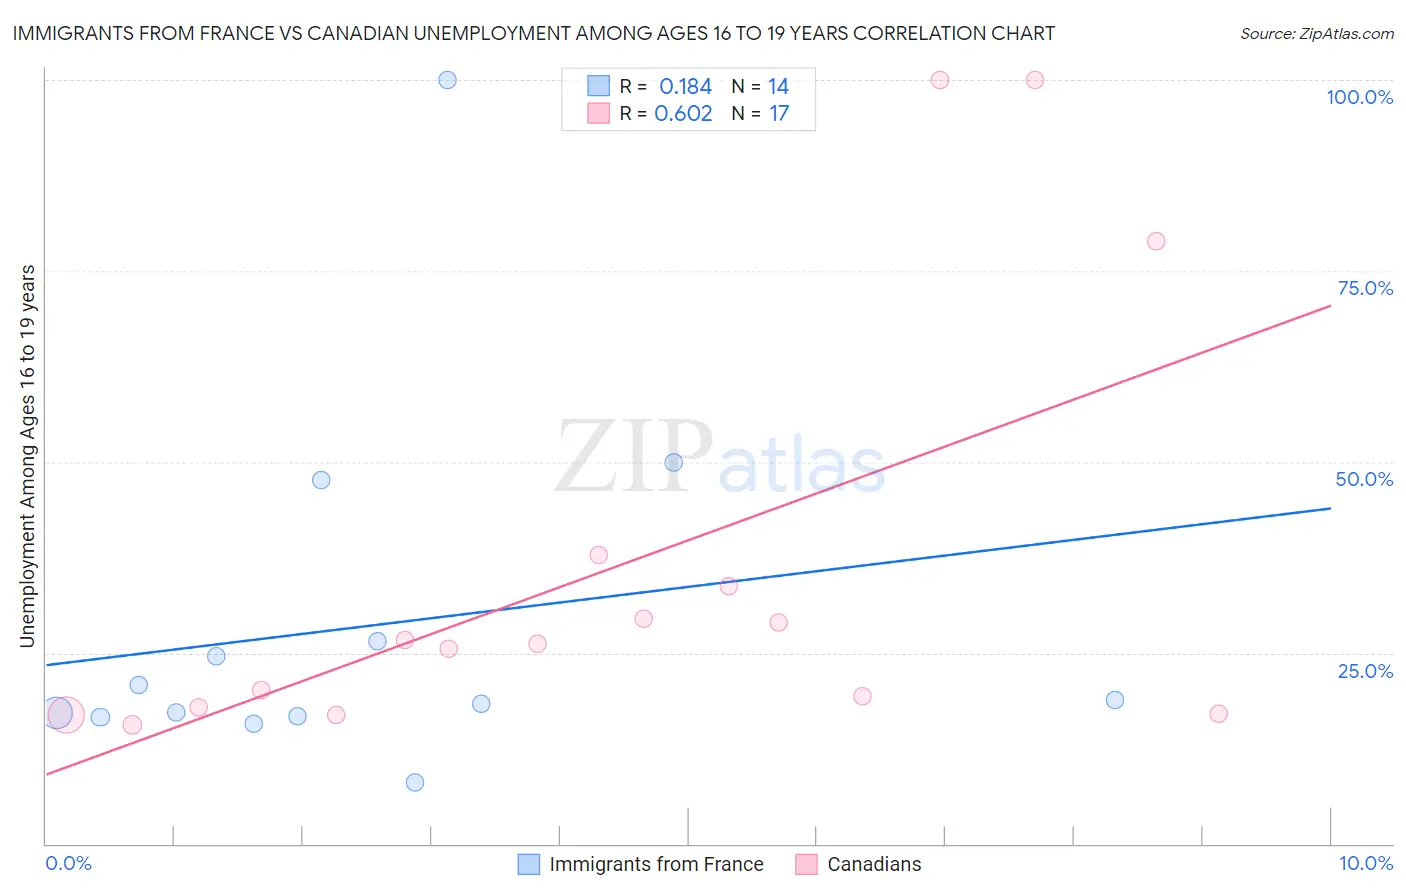
Immigrants from France vs Canadian Unemployment Among Ages 16 to 19 years Correlation Chart
The statistical analysis conducted on geographies consisting of 275,602,190 people shows a poor positive correlation between the proportion of Immigrants from France and unemployment rate among population between the ages 16 and 19 in the United States with a correlation coefficient (R) of 0.184 and weighted average of 17.5%. Similarly, the statistical analysis conducted on geographies consisting of 409,401,649 people shows a significant positive correlation between the proportion of Canadians and unemployment rate among population between the ages 16 and 19 in the United States with a correlation coefficient (R) of 0.602 and weighted average of 16.9%, a difference of 3.9%.
Unemployment Among Ages 16 to 19 years Correlation Summary
| Measurement | Immigrants from France | Canadian |
| Minimum | 8.0% | 15.6% |
| Maximum | 100.0% | 100.0% |
| Range | 92.0% | 84.4% |
| Mean | 28.4% | 35.9% |
| Median | 18.5% | 26.2% |
| Interquartile 25% (IQ1) | 16.7% | 17.4% |
| Interquartile 75% (IQ3) | 26.5% | 35.8% |
| Interquartile Range (IQR) | 9.8% | 18.4% |
| Standard Deviation (Sample) | 23.8% | 28.3% |
| Standard Deviation (Population) | 22.9% | 27.4% |
Similar Demographics by Unemployment Among Ages 16 to 19 years
Demographics Similar to Immigrants from France by Unemployment Among Ages 16 to 19 years
In terms of unemployment among ages 16 to 19 years, the demographic groups most similar to Immigrants from France are Immigrants from Hungary (17.5%, a difference of 0.010%), Immigrants from Italy (17.5%, a difference of 0.020%), Immigrants from Cambodia (17.5%, a difference of 0.020%), Cape Verdean (17.5%, a difference of 0.040%), and Immigrants from Romania (17.5%, a difference of 0.080%).
| Demographics | Rating | Rank | Unemployment Among Ages 16 to 19 years |
| Ukrainians | 60.5 /100 | #160 | Good 17.5% |
| Immigrants | Denmark | 60.3 /100 | #161 | Good 17.5% |
| Immigrants | Norway | 59.8 /100 | #162 | Average 17.5% |
| Egyptians | 59.7 /100 | #163 | Average 17.5% |
| Immigrants | Austria | 57.7 /100 | #164 | Average 17.5% |
| Cape Verdeans | 55.8 /100 | #165 | Average 17.5% |
| Immigrants | Italy | 55.2 /100 | #166 | Average 17.5% |
| Immigrants | France | 54.9 /100 | #167 | Average 17.5% |
| Immigrants | Hungary | 54.7 /100 | #168 | Average 17.5% |
| Immigrants | Cambodia | 54.5 /100 | #169 | Average 17.5% |
| Immigrants | Romania | 53.3 /100 | #170 | Average 17.5% |
| Immigrants | Switzerland | 53.2 /100 | #171 | Average 17.5% |
| Immigrants | Western Europe | 52.2 /100 | #172 | Average 17.6% |
| Chileans | 50.8 /100 | #173 | Average 17.6% |
| Osage | 50.0 /100 | #174 | Average 17.6% |
Demographics Similar to Canadians by Unemployment Among Ages 16 to 19 years
In terms of unemployment among ages 16 to 19 years, the demographic groups most similar to Canadians are Asian (16.9%, a difference of 0.040%), Immigrants from South Africa (16.9%, a difference of 0.090%), Cambodian (16.9%, a difference of 0.12%), Greek (16.9%, a difference of 0.15%), and Immigrants from Scotland (16.8%, a difference of 0.22%).
| Demographics | Rating | Rank | Unemployment Among Ages 16 to 19 years |
| Whites/Caucasians | 97.5 /100 | #82 | Exceptional 16.8% |
| Ugandans | 97.4 /100 | #83 | Exceptional 16.8% |
| French | 97.4 /100 | #84 | Exceptional 16.8% |
| Immigrants | Kuwait | 97.2 /100 | #85 | Exceptional 16.8% |
| Immigrants | Scotland | 97.2 /100 | #86 | Exceptional 16.8% |
| Greeks | 97.0 /100 | #87 | Exceptional 16.9% |
| Immigrants | South Africa | 96.9 /100 | #88 | Exceptional 16.9% |
| Canadians | 96.7 /100 | #89 | Exceptional 16.9% |
| Asians | 96.6 /100 | #90 | Exceptional 16.9% |
| Cambodians | 96.3 /100 | #91 | Exceptional 16.9% |
| South Africans | 95.9 /100 | #92 | Exceptional 16.9% |
| Cubans | 95.8 /100 | #93 | Exceptional 16.9% |
| Bangladeshis | 95.8 /100 | #94 | Exceptional 16.9% |
| Mongolians | 95.6 /100 | #95 | Exceptional 16.9% |
| Ottawa | 95.4 /100 | #96 | Exceptional 16.9% |