Immigrants from Fiji vs Uruguayan Unemployment Among Ages 65 to 74 years
COMPARE
Immigrants from Fiji
Uruguayan
Unemployment Among Ages 65 to 74 years
Unemployment Among Ages 65 to 74 years Comparison
Immigrants from Fiji
Uruguayans
5.3%
UNEMPLOYMENT AMONG AGES 65 TO 74 YEARS
89.9/ 100
METRIC RATING
119th/ 347
METRIC RANK
5.5%
UNEMPLOYMENT AMONG AGES 65 TO 74 YEARS
6.2/ 100
METRIC RATING
216th/ 347
METRIC RANK
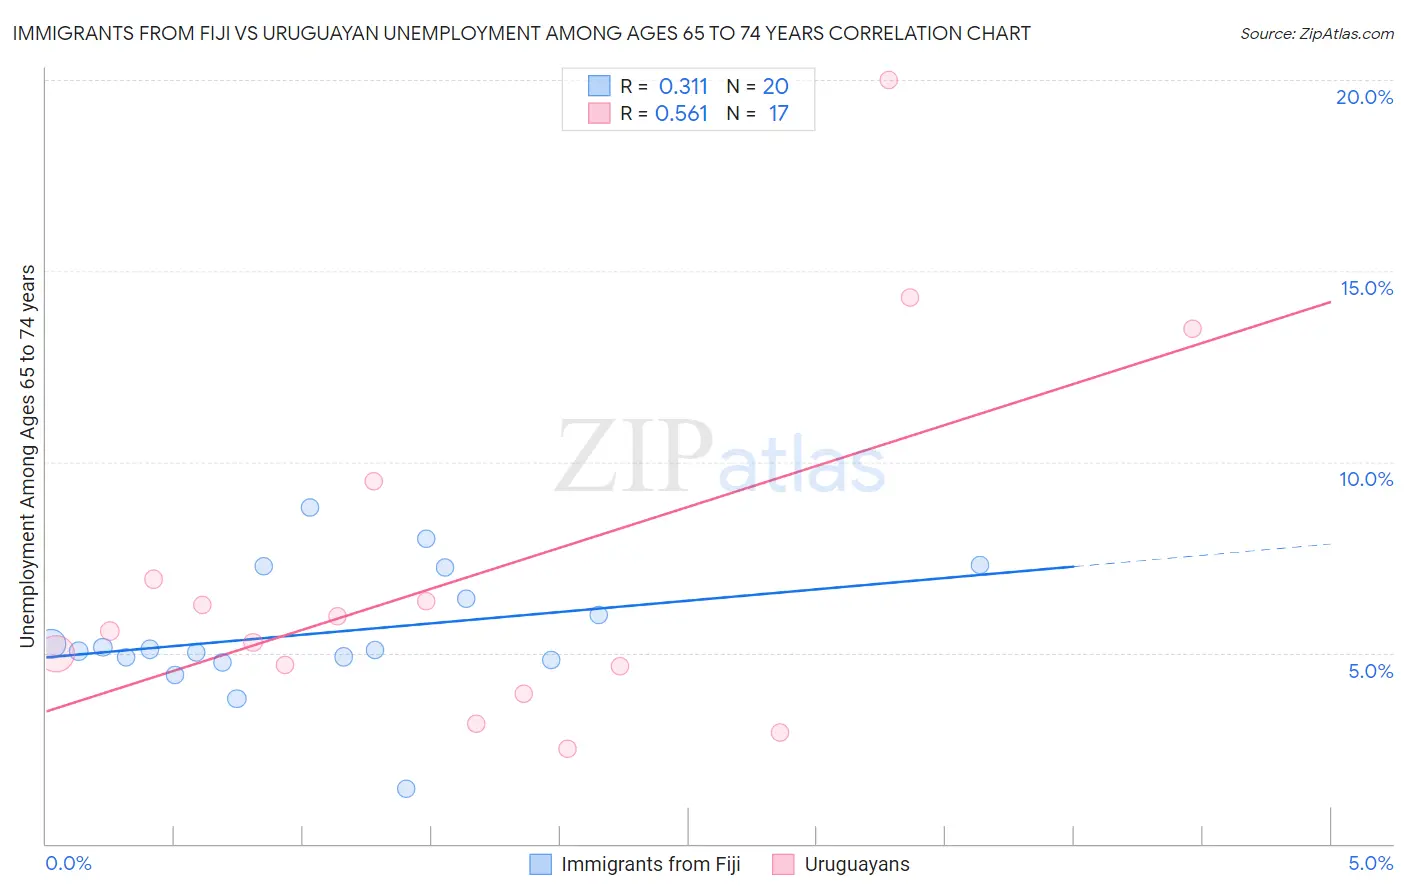
Immigrants from Fiji vs Uruguayan Unemployment Among Ages 65 to 74 years Correlation Chart
The statistical analysis conducted on geographies consisting of 90,875,460 people shows a mild positive correlation between the proportion of Immigrants from Fiji and unemployment rate among population between the ages 65 and 74 in the United States with a correlation coefficient (R) of 0.311 and weighted average of 5.3%. Similarly, the statistical analysis conducted on geographies consisting of 138,083,265 people shows a substantial positive correlation between the proportion of Uruguayans and unemployment rate among population between the ages 65 and 74 in the United States with a correlation coefficient (R) of 0.561 and weighted average of 5.5%, a difference of 4.2%.
Unemployment Among Ages 65 to 74 years Correlation Summary
| Measurement | Immigrants from Fiji | Uruguayan |
| Minimum | 1.4% | 2.5% |
| Maximum | 8.8% | 20.0% |
| Range | 7.4% | 17.5% |
| Mean | 5.5% | 7.1% |
| Median | 5.1% | 5.6% |
| Interquartile 25% (IQ1) | 4.8% | 4.3% |
| Interquartile 75% (IQ3) | 6.8% | 8.2% |
| Interquartile Range (IQR) | 2.0% | 3.9% |
| Standard Deviation (Sample) | 1.6% | 4.7% |
| Standard Deviation (Population) | 1.6% | 4.6% |
Similar Demographics by Unemployment Among Ages 65 to 74 years
Demographics Similar to Immigrants from Fiji by Unemployment Among Ages 65 to 74 years
In terms of unemployment among ages 65 to 74 years, the demographic groups most similar to Immigrants from Fiji are Immigrants from Switzerland (5.3%, a difference of 0.0%), Immigrants from Belarus (5.3%, a difference of 0.010%), Immigrants from Korea (5.3%, a difference of 0.030%), Australian (5.3%, a difference of 0.050%), and Immigrants from Australia (5.3%, a difference of 0.070%).
| Demographics | Rating | Rank | Unemployment Among Ages 65 to 74 years |
| Immigrants | South Central Asia | 92.4 /100 | #112 | Exceptional 5.3% |
| Immigrants | Germany | 91.6 /100 | #113 | Exceptional 5.3% |
| Asians | 91.1 /100 | #114 | Exceptional 5.3% |
| Immigrants | Turkey | 90.8 /100 | #115 | Exceptional 5.3% |
| Australians | 90.4 /100 | #116 | Exceptional 5.3% |
| Immigrants | Korea | 90.2 /100 | #117 | Exceptional 5.3% |
| Immigrants | Belarus | 90.1 /100 | #118 | Exceptional 5.3% |
| Immigrants | Fiji | 89.9 /100 | #119 | Excellent 5.3% |
| Immigrants | Switzerland | 89.9 /100 | #120 | Excellent 5.3% |
| Immigrants | Australia | 89.1 /100 | #121 | Excellent 5.3% |
| Immigrants | Canada | 89.0 /100 | #122 | Excellent 5.3% |
| Czechoslovakians | 88.6 /100 | #123 | Excellent 5.3% |
| Immigrants | Ukraine | 87.5 /100 | #124 | Excellent 5.3% |
| Pakistanis | 87.5 /100 | #125 | Excellent 5.3% |
| Immigrants | South Eastern Asia | 87.2 /100 | #126 | Excellent 5.3% |
Demographics Similar to Uruguayans by Unemployment Among Ages 65 to 74 years
In terms of unemployment among ages 65 to 74 years, the demographic groups most similar to Uruguayans are Blackfeet (5.5%, a difference of 0.060%), Samoan (5.5%, a difference of 0.080%), Alsatian (5.5%, a difference of 0.10%), American (5.5%, a difference of 0.13%), and Egyptian (5.5%, a difference of 0.17%).
| Demographics | Rating | Rank | Unemployment Among Ages 65 to 74 years |
| Immigrants | Honduras | 10.4 /100 | #209 | Poor 5.5% |
| Immigrants | Northern Africa | 10.1 /100 | #210 | Poor 5.5% |
| Immigrants | Croatia | 9.1 /100 | #211 | Tragic 5.5% |
| Haitians | 7.7 /100 | #212 | Tragic 5.5% |
| Italians | 7.7 /100 | #213 | Tragic 5.5% |
| Egyptians | 7.6 /100 | #214 | Tragic 5.5% |
| Americans | 7.3 /100 | #215 | Tragic 5.5% |
| Uruguayans | 6.2 /100 | #216 | Tragic 5.5% |
| Blackfeet | 5.8 /100 | #217 | Tragic 5.5% |
| Samoans | 5.7 /100 | #218 | Tragic 5.5% |
| Alsatians | 5.6 /100 | #219 | Tragic 5.5% |
| Immigrants | Syria | 5.1 /100 | #220 | Tragic 5.5% |
| Spaniards | 4.8 /100 | #221 | Tragic 5.5% |
| Apache | 4.5 /100 | #222 | Tragic 5.5% |
| Hungarians | 4.4 /100 | #223 | Tragic 5.5% |