Immigrants from Europe vs Okinawan Unemployment Among Ages 30 to 34 years
COMPARE
Immigrants from Europe
Okinawan
Unemployment Among Ages 30 to 34 years
Unemployment Among Ages 30 to 34 years Comparison
Immigrants from Europe
Okinawans
5.4%
UNEMPLOYMENT AMONG AGES 30 TO 34 YEARS
72.1/ 100
METRIC RATING
141st/ 347
METRIC RANK
4.8%
UNEMPLOYMENT AMONG AGES 30 TO 34 YEARS
99.9/ 100
METRIC RATING
15th/ 347
METRIC RANK
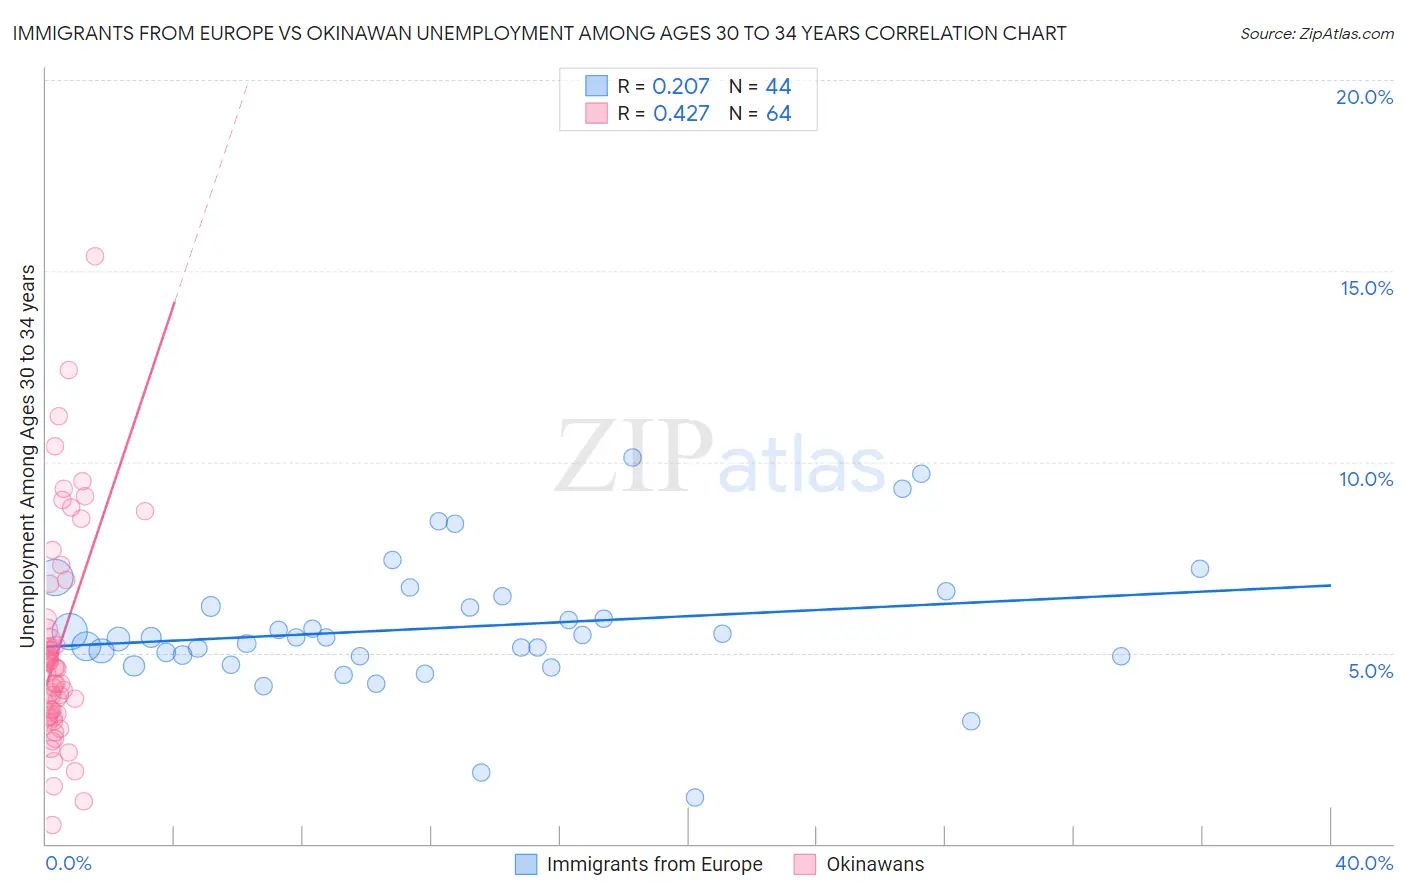
Immigrants from Europe vs Okinawan Unemployment Among Ages 30 to 34 years Correlation Chart
The statistical analysis conducted on geographies consisting of 487,978,612 people shows a weak positive correlation between the proportion of Immigrants from Europe and unemployment rate among population between the ages 30 and 34 in the United States with a correlation coefficient (R) of 0.207 and weighted average of 5.4%. Similarly, the statistical analysis conducted on geographies consisting of 72,910,776 people shows a moderate positive correlation between the proportion of Okinawans and unemployment rate among population between the ages 30 and 34 in the United States with a correlation coefficient (R) of 0.427 and weighted average of 4.8%, a difference of 11.2%.
Unemployment Among Ages 30 to 34 years Correlation Summary
| Measurement | Immigrants from Europe | Okinawan |
| Minimum | 1.2% | 0.50% |
| Maximum | 10.1% | 15.4% |
| Range | 8.9% | 14.9% |
| Mean | 5.7% | 5.1% |
| Median | 5.4% | 4.5% |
| Interquartile 25% (IQ1) | 4.9% | 3.4% |
| Interquartile 75% (IQ3) | 6.3% | 5.7% |
| Interquartile Range (IQR) | 1.4% | 2.4% |
| Standard Deviation (Sample) | 1.7% | 2.8% |
| Standard Deviation (Population) | 1.7% | 2.8% |
Similar Demographics by Unemployment Among Ages 30 to 34 years
Demographics Similar to Immigrants from Europe by Unemployment Among Ages 30 to 34 years
In terms of unemployment among ages 30 to 34 years, the demographic groups most similar to Immigrants from Europe are Immigrants from Greece (5.4%, a difference of 0.0%), Immigrants from North America (5.4%, a difference of 0.020%), Lithuanian (5.4%, a difference of 0.030%), Serbian (5.4%, a difference of 0.080%), and Russian (5.4%, a difference of 0.080%).
| Demographics | Rating | Rank | Unemployment Among Ages 30 to 34 years |
| Bangladeshis | 76.6 /100 | #134 | Good 5.3% |
| Palestinians | 75.1 /100 | #135 | Good 5.4% |
| Pakistanis | 74.6 /100 | #136 | Good 5.4% |
| Immigrants | Canada | 74.6 /100 | #137 | Good 5.4% |
| Serbians | 72.9 /100 | #138 | Good 5.4% |
| Lithuanians | 72.4 /100 | #139 | Good 5.4% |
| Immigrants | North America | 72.2 /100 | #140 | Good 5.4% |
| Immigrants | Europe | 72.1 /100 | #141 | Good 5.4% |
| Immigrants | Greece | 72.0 /100 | #142 | Good 5.4% |
| Russians | 71.1 /100 | #143 | Good 5.4% |
| Immigrants | Russia | 71.0 /100 | #144 | Good 5.4% |
| Syrians | 70.3 /100 | #145 | Good 5.4% |
| Celtics | 70.2 /100 | #146 | Good 5.4% |
| Ukrainians | 69.2 /100 | #147 | Good 5.4% |
| Immigrants | Iran | 69.1 /100 | #148 | Good 5.4% |
Demographics Similar to Okinawans by Unemployment Among Ages 30 to 34 years
In terms of unemployment among ages 30 to 34 years, the demographic groups most similar to Okinawans are Zimbabwean (4.8%, a difference of 0.11%), Immigrants from Bulgaria (4.8%, a difference of 0.22%), Luxembourger (4.8%, a difference of 0.37%), Cambodian (4.8%, a difference of 0.38%), and Filipino (4.8%, a difference of 0.39%).
| Demographics | Rating | Rank | Unemployment Among Ages 30 to 34 years |
| Immigrants | Eritrea | 100.0 /100 | #8 | Exceptional 4.7% |
| Bulgarians | 99.9 /100 | #9 | Exceptional 4.7% |
| Tongans | 99.9 /100 | #10 | Exceptional 4.8% |
| Immigrants | Bolivia | 99.9 /100 | #11 | Exceptional 4.8% |
| Filipinos | 99.9 /100 | #12 | Exceptional 4.8% |
| Cambodians | 99.9 /100 | #13 | Exceptional 4.8% |
| Luxembourgers | 99.9 /100 | #14 | Exceptional 4.8% |
| Okinawans | 99.9 /100 | #15 | Exceptional 4.8% |
| Zimbabweans | 99.9 /100 | #16 | Exceptional 4.8% |
| Immigrants | Bulgaria | 99.9 /100 | #17 | Exceptional 4.8% |
| Bolivians | 99.8 /100 | #18 | Exceptional 4.9% |
| Immigrants | Sudan | 99.8 /100 | #19 | Exceptional 4.9% |
| Immigrants | Taiwan | 99.8 /100 | #20 | Exceptional 4.9% |
| Ethiopians | 99.8 /100 | #21 | Exceptional 4.9% |
| Immigrants | South Central Asia | 99.8 /100 | #22 | Exceptional 4.9% |