Immigrants from Europe vs Immigrants from Northern Africa Unemployment Among Women with Children Under 18 years
COMPARE
Immigrants from Europe
Immigrants from Northern Africa
Unemployment Among Women with Children Under 18 years
Unemployment Among Women with Children Under 18 years Comparison
Immigrants from Europe
Immigrants from Northern Africa
5.3%
UNEMPLOYMENT AMONG WOMEN WITH CHILDREN UNDER 18 YEARS
86.7/ 100
METRIC RATING
118th/ 347
METRIC RANK
5.4%
UNEMPLOYMENT AMONG WOMEN WITH CHILDREN UNDER 18 YEARS
56.1/ 100
METRIC RATING
168th/ 347
METRIC RANK
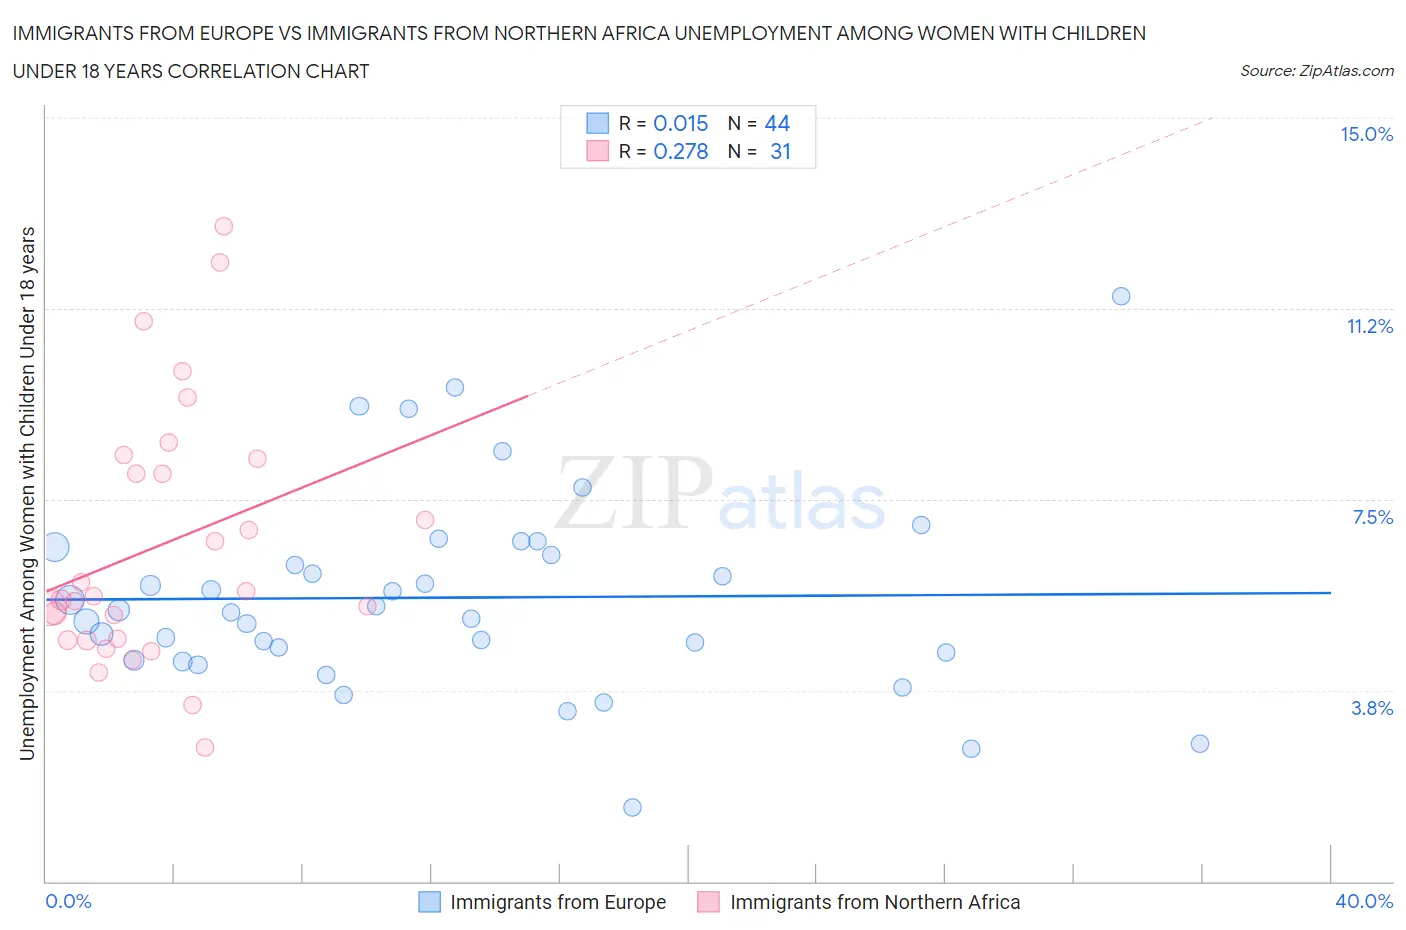
Immigrants from Europe vs Immigrants from Northern Africa Unemployment Among Women with Children Under 18 years Correlation Chart
The statistical analysis conducted on geographies consisting of 503,208,698 people shows no correlation between the proportion of Immigrants from Europe and unemployment rate among women with children under the age of 18 in the United States with a correlation coefficient (R) of 0.015 and weighted average of 5.3%. Similarly, the statistical analysis conducted on geographies consisting of 313,241,785 people shows a weak positive correlation between the proportion of Immigrants from Northern Africa and unemployment rate among women with children under the age of 18 in the United States with a correlation coefficient (R) of 0.278 and weighted average of 5.4%, a difference of 3.0%.
Unemployment Among Women with Children Under 18 years Correlation Summary
| Measurement | Immigrants from Europe | Immigrants from Northern Africa |
| Minimum | 1.4% | 2.6% |
| Maximum | 11.5% | 12.9% |
| Range | 10.1% | 10.2% |
| Mean | 5.6% | 6.6% |
| Median | 5.3% | 5.6% |
| Interquartile 25% (IQ1) | 4.4% | 4.7% |
| Interquartile 75% (IQ3) | 6.5% | 8.3% |
| Interquartile Range (IQR) | 2.1% | 3.6% |
| Standard Deviation (Sample) | 2.0% | 2.5% |
| Standard Deviation (Population) | 1.9% | 2.5% |
Similar Demographics by Unemployment Among Women with Children Under 18 years
Demographics Similar to Immigrants from Europe by Unemployment Among Women with Children Under 18 years
In terms of unemployment among women with children under 18 years, the demographic groups most similar to Immigrants from Europe are Basque (5.3%, a difference of 0.030%), Egyptian (5.3%, a difference of 0.050%), Canadian (5.3%, a difference of 0.10%), Immigrants from Romania (5.3%, a difference of 0.15%), and Macedonian (5.3%, a difference of 0.16%).
| Demographics | Rating | Rank | Unemployment Among Women with Children Under 18 years |
| French Canadians | 88.9 /100 | #111 | Excellent 5.2% |
| Immigrants | Eastern Europe | 88.5 /100 | #112 | Excellent 5.2% |
| French | 88.4 /100 | #113 | Excellent 5.2% |
| Kenyans | 88.2 /100 | #114 | Excellent 5.3% |
| Hungarians | 88.1 /100 | #115 | Excellent 5.3% |
| Macedonians | 87.7 /100 | #116 | Excellent 5.3% |
| Canadians | 87.4 /100 | #117 | Excellent 5.3% |
| Immigrants | Europe | 86.7 /100 | #118 | Excellent 5.3% |
| Basques | 86.5 /100 | #119 | Excellent 5.3% |
| Egyptians | 86.4 /100 | #120 | Excellent 5.3% |
| Immigrants | Romania | 85.8 /100 | #121 | Excellent 5.3% |
| Scotch-Irish | 85.7 /100 | #122 | Excellent 5.3% |
| Sudanese | 84.3 /100 | #123 | Excellent 5.3% |
| Native Hawaiians | 84.0 /100 | #124 | Excellent 5.3% |
| Immigrants | North Macedonia | 83.2 /100 | #125 | Excellent 5.3% |
Demographics Similar to Immigrants from Northern Africa by Unemployment Among Women with Children Under 18 years
In terms of unemployment among women with children under 18 years, the demographic groups most similar to Immigrants from Northern Africa are Immigrants from Thailand (5.4%, a difference of 0.060%), Immigrants from Denmark (5.4%, a difference of 0.14%), Samoan (5.4%, a difference of 0.14%), Immigrants from Philippines (5.4%, a difference of 0.21%), and Aleut (5.4%, a difference of 0.24%).
| Demographics | Rating | Rank | Unemployment Among Women with Children Under 18 years |
| Immigrants | Iraq | 65.9 /100 | #161 | Good 5.4% |
| Immigrants | Saudi Arabia | 65.0 /100 | #162 | Good 5.4% |
| Lebanese | 64.7 /100 | #163 | Good 5.4% |
| Celtics | 63.0 /100 | #164 | Good 5.4% |
| Tlingit-Haida | 61.9 /100 | #165 | Good 5.4% |
| Aleuts | 59.4 /100 | #166 | Average 5.4% |
| Immigrants | Denmark | 58.0 /100 | #167 | Average 5.4% |
| Immigrants | Northern Africa | 56.1 /100 | #168 | Average 5.4% |
| Immigrants | Thailand | 55.3 /100 | #169 | Average 5.4% |
| Samoans | 54.1 /100 | #170 | Average 5.4% |
| Immigrants | Philippines | 53.1 /100 | #171 | Average 5.4% |
| Immigrants | Kazakhstan | 51.7 /100 | #172 | Average 5.4% |
| Immigrants | Eastern Africa | 51.3 /100 | #173 | Average 5.4% |
| Immigrants | Uzbekistan | 50.0 /100 | #174 | Average 5.4% |
| Spanish | 49.0 /100 | #175 | Average 5.4% |