Immigrants from Europe vs Immigrants from Africa Unemployment Among Ages 55 to 59 years
COMPARE
Immigrants from Europe
Immigrants from Africa
Unemployment Among Ages 55 to 59 years
Unemployment Among Ages 55 to 59 years Comparison
Immigrants from Europe
Immigrants from Africa
4.8%
UNEMPLOYMENT AMONG AGES 55 TO 59 YEARS
40.4/ 100
METRIC RATING
182nd/ 347
METRIC RANK
4.8%
UNEMPLOYMENT AMONG AGES 55 TO 59 YEARS
64.2/ 100
METRIC RATING
162nd/ 347
METRIC RANK
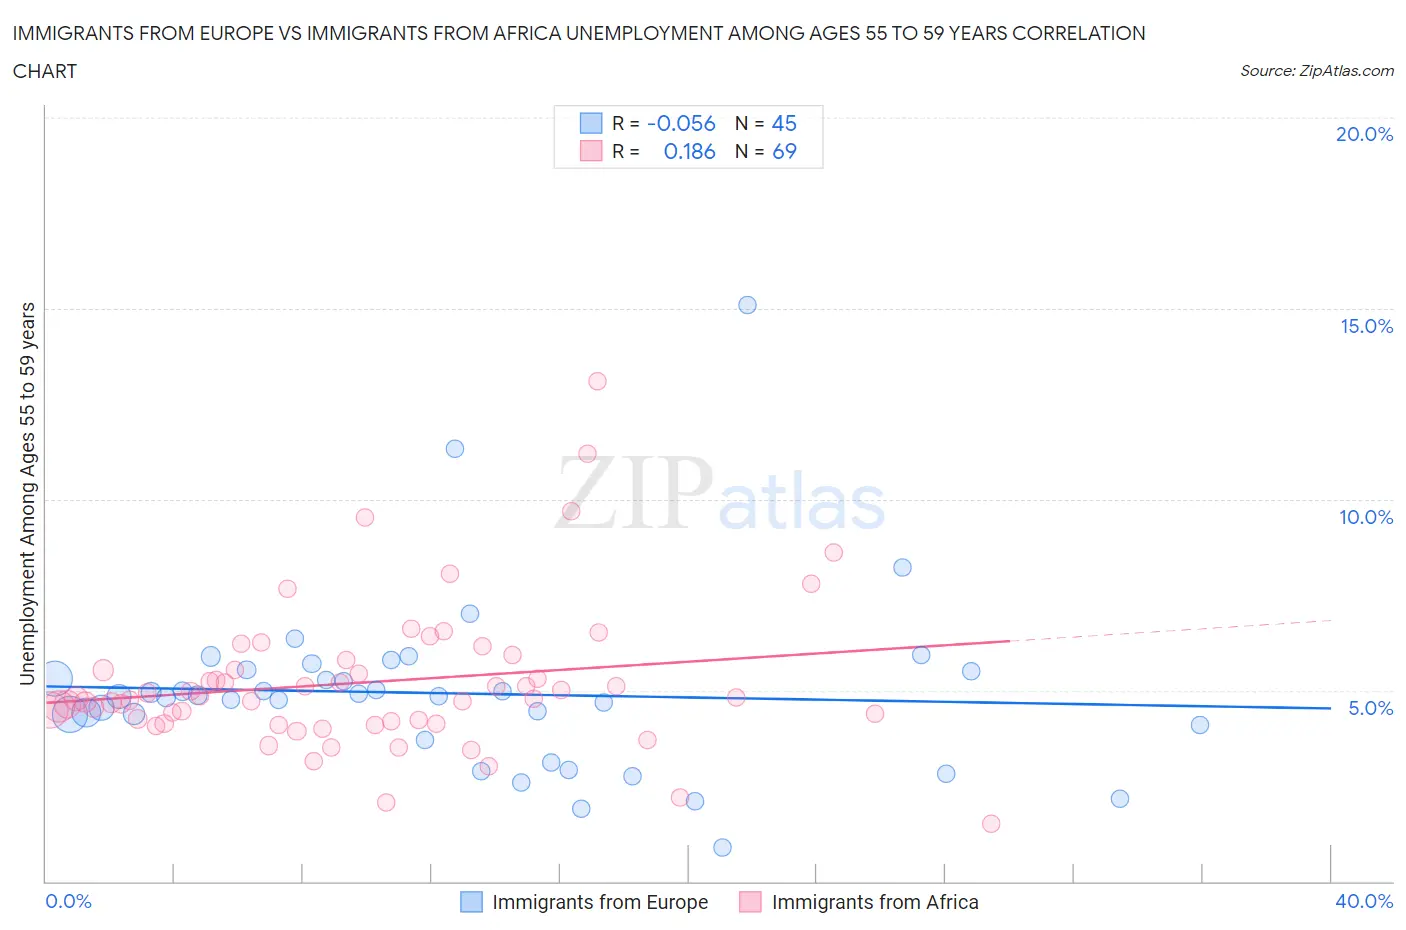
Immigrants from Europe vs Immigrants from Africa Unemployment Among Ages 55 to 59 years Correlation Chart
The statistical analysis conducted on geographies consisting of 478,537,911 people shows a slight negative correlation between the proportion of Immigrants from Europe and unemployment rate among population between the ages 55 and 59 in the United States with a correlation coefficient (R) of -0.056 and weighted average of 4.8%. Similarly, the statistical analysis conducted on geographies consisting of 429,302,225 people shows a poor positive correlation between the proportion of Immigrants from Africa and unemployment rate among population between the ages 55 and 59 in the United States with a correlation coefficient (R) of 0.186 and weighted average of 4.8%, a difference of 1.0%.
Unemployment Among Ages 55 to 59 years Correlation Summary
| Measurement | Immigrants from Europe | Immigrants from Africa |
| Minimum | 0.90% | 1.5% |
| Maximum | 15.1% | 13.1% |
| Range | 14.2% | 11.6% |
| Mean | 4.9% | 5.2% |
| Median | 4.8% | 4.8% |
| Interquartile 25% (IQ1) | 3.9% | 4.2% |
| Interquartile 75% (IQ3) | 5.5% | 5.7% |
| Interquartile Range (IQR) | 1.6% | 1.5% |
| Standard Deviation (Sample) | 2.3% | 1.9% |
| Standard Deviation (Population) | 2.3% | 1.9% |
Demographics Similar to Immigrants from Europe and Immigrants from Africa by Unemployment Among Ages 55 to 59 years
In terms of unemployment among ages 55 to 59 years, the demographic groups most similar to Immigrants from Europe are Immigrants from Hungary (4.8%, a difference of 0.0%), South American (4.8%, a difference of 0.15%), Hungarian (4.8%, a difference of 0.16%), Arab (4.8%, a difference of 0.18%), and Immigrants from Sri Lanka (4.8%, a difference of 0.27%). Similarly, the demographic groups most similar to Immigrants from Africa are Immigrants from Lebanon (4.8%, a difference of 0.020%), American (4.8%, a difference of 0.040%), Immigrants from France (4.8%, a difference of 0.090%), Potawatomi (4.8%, a difference of 0.10%), and Immigrants from Western Europe (4.8%, a difference of 0.17%).
| Demographics | Rating | Rank | Unemployment Among Ages 55 to 59 years |
| Immigrants | Africa | 64.2 /100 | #162 | Good 4.8% |
| Immigrants | Lebanon | 63.8 /100 | #163 | Good 4.8% |
| Americans | 63.3 /100 | #164 | Good 4.8% |
| Immigrants | France | 62.0 /100 | #165 | Good 4.8% |
| Potawatomi | 62.0 /100 | #166 | Good 4.8% |
| Immigrants | Western Europe | 60.4 /100 | #167 | Good 4.8% |
| Immigrants | Cambodia | 59.3 /100 | #168 | Average 4.8% |
| Immigrants | Sudan | 58.4 /100 | #169 | Average 4.8% |
| Uruguayans | 55.6 /100 | #170 | Average 4.8% |
| Japanese | 54.5 /100 | #171 | Average 4.8% |
| Nicaraguans | 54.0 /100 | #172 | Average 4.8% |
| Immigrants | Eastern Europe | 52.2 /100 | #173 | Average 4.8% |
| Immigrants | Croatia | 50.0 /100 | #174 | Average 4.8% |
| Australians | 48.6 /100 | #175 | Average 4.8% |
| Samoans | 47.1 /100 | #176 | Average 4.8% |
| Immigrants | Sri Lanka | 46.8 /100 | #177 | Average 4.8% |
| Arabs | 44.7 /100 | #178 | Average 4.8% |
| Hungarians | 44.3 /100 | #179 | Average 4.8% |
| South Americans | 44.0 /100 | #180 | Average 4.8% |
| Immigrants | Hungary | 40.4 /100 | #181 | Average 4.8% |
| Immigrants | Europe | 40.4 /100 | #182 | Average 4.8% |