Immigrants from Ethiopia vs Zimbabwean Unemployment Among Women with Children Under 6 years
COMPARE
Immigrants from Ethiopia
Zimbabwean
Unemployment Among Women with Children Under 6 years
Unemployment Among Women with Children Under 6 years Comparison
Immigrants from Ethiopia
Zimbabweans
6.9%
UNEMPLOYMENT AMONG WOMEN WITH CHILDREN UNDER 6 YEARS
99.8/ 100
METRIC RATING
56th/ 347
METRIC RANK
7.3%
UNEMPLOYMENT AMONG WOMEN WITH CHILDREN UNDER 6 YEARS
91.5/ 100
METRIC RATING
128th/ 347
METRIC RANK
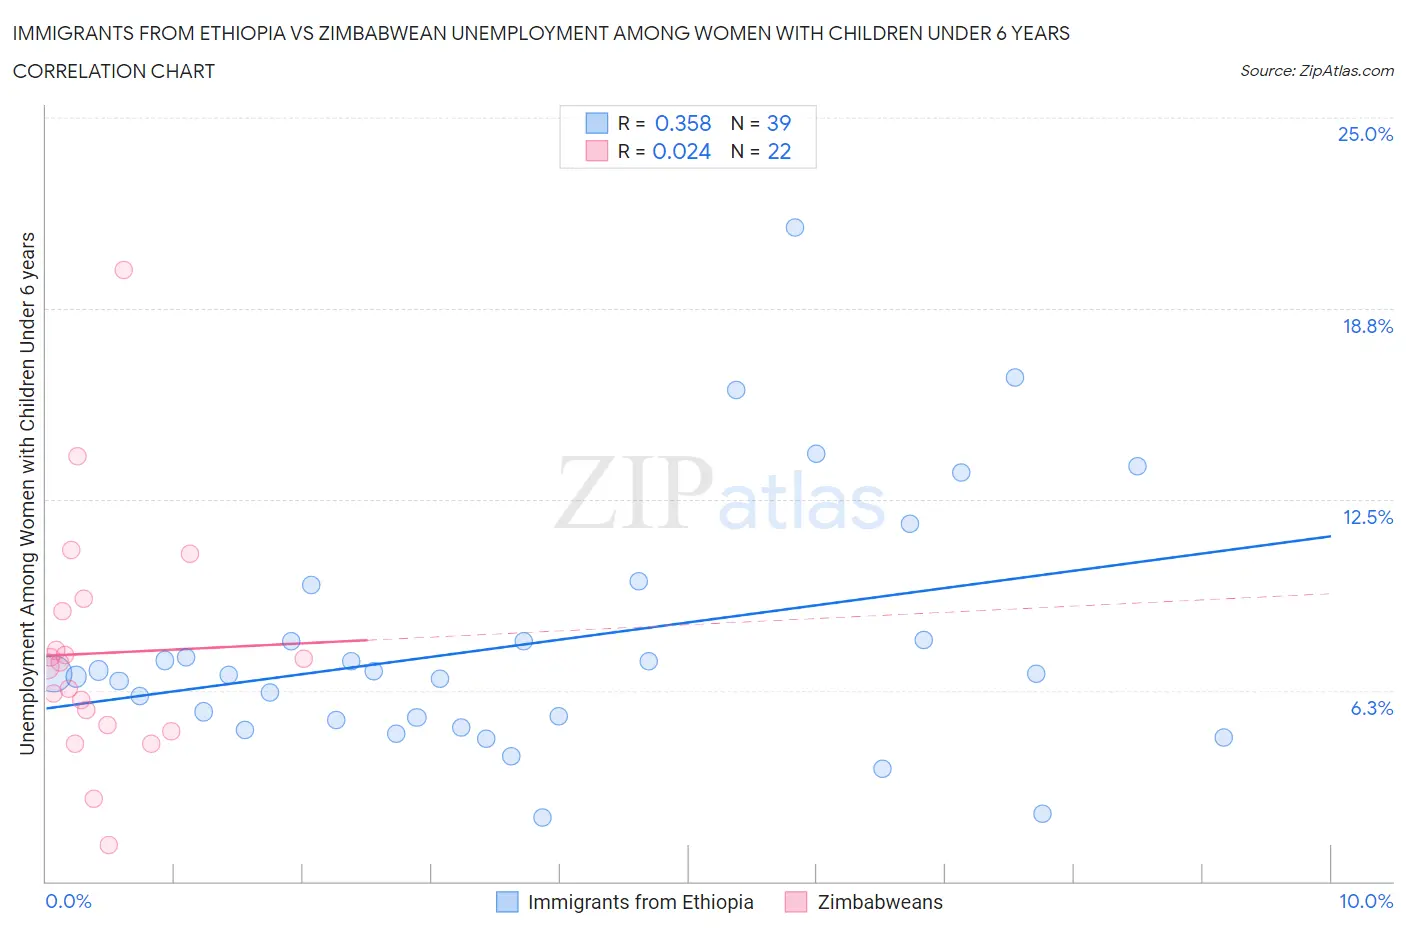
Immigrants from Ethiopia vs Zimbabwean Unemployment Among Women with Children Under 6 years Correlation Chart
The statistical analysis conducted on geographies consisting of 180,200,424 people shows a mild positive correlation between the proportion of Immigrants from Ethiopia and unemployment rate among women with children under the age of 6 in the United States with a correlation coefficient (R) of 0.358 and weighted average of 6.9%. Similarly, the statistical analysis conducted on geographies consisting of 63,906,622 people shows no correlation between the proportion of Zimbabweans and unemployment rate among women with children under the age of 6 in the United States with a correlation coefficient (R) of 0.024 and weighted average of 7.3%, a difference of 7.2%.
Unemployment Among Women with Children Under 6 years Correlation Summary
| Measurement | Immigrants from Ethiopia | Zimbabwean |
| Minimum | 2.1% | 1.2% |
| Maximum | 21.4% | 20.0% |
| Range | 19.3% | 18.8% |
| Mean | 7.8% | 7.5% |
| Median | 6.8% | 7.1% |
| Interquartile 25% (IQ1) | 5.3% | 5.1% |
| Interquartile 75% (IQ3) | 7.9% | 8.9% |
| Interquartile Range (IQR) | 2.6% | 3.7% |
| Standard Deviation (Sample) | 4.1% | 3.9% |
| Standard Deviation (Population) | 4.0% | 3.9% |
Similar Demographics by Unemployment Among Women with Children Under 6 years
Demographics Similar to Immigrants from Ethiopia by Unemployment Among Women with Children Under 6 years
In terms of unemployment among women with children under 6 years, the demographic groups most similar to Immigrants from Ethiopia are Icelander (6.9%, a difference of 0.010%), Immigrants from Ukraine (6.8%, a difference of 0.10%), Immigrants from Turkey (6.9%, a difference of 0.23%), Immigrants from Serbia (6.9%, a difference of 0.30%), and Immigrants from Sri Lanka (6.9%, a difference of 0.38%).
| Demographics | Rating | Rank | Unemployment Among Women with Children Under 6 years |
| Immigrants | Nepal | 99.9 /100 | #49 | Exceptional 6.8% |
| Immigrants | Ireland | 99.9 /100 | #50 | Exceptional 6.8% |
| Ethiopians | 99.9 /100 | #51 | Exceptional 6.8% |
| Immigrants | Iran | 99.9 /100 | #52 | Exceptional 6.8% |
| Chinese | 99.9 /100 | #53 | Exceptional 6.8% |
| Immigrants | Latvia | 99.9 /100 | #54 | Exceptional 6.8% |
| Immigrants | Ukraine | 99.8 /100 | #55 | Exceptional 6.8% |
| Immigrants | Ethiopia | 99.8 /100 | #56 | Exceptional 6.9% |
| Icelanders | 99.8 /100 | #57 | Exceptional 6.9% |
| Immigrants | Turkey | 99.8 /100 | #58 | Exceptional 6.9% |
| Immigrants | Serbia | 99.8 /100 | #59 | Exceptional 6.9% |
| Immigrants | Sri Lanka | 99.8 /100 | #60 | Exceptional 6.9% |
| Immigrants | France | 99.7 /100 | #61 | Exceptional 6.9% |
| Somalis | 99.7 /100 | #62 | Exceptional 6.9% |
| Maltese | 99.7 /100 | #63 | Exceptional 6.9% |
Demographics Similar to Zimbabweans by Unemployment Among Women with Children Under 6 years
In terms of unemployment among women with children under 6 years, the demographic groups most similar to Zimbabweans are Jordanian (7.3%, a difference of 0.0%), Immigrants from Burma/Myanmar (7.3%, a difference of 0.10%), Pakistani (7.3%, a difference of 0.17%), Immigrants from South Africa (7.3%, a difference of 0.25%), and Immigrants from Zaire (7.3%, a difference of 0.45%).
| Demographics | Rating | Rank | Unemployment Among Women with Children Under 6 years |
| Immigrants | Chile | 93.5 /100 | #121 | Exceptional 7.3% |
| Immigrants | Bosnia and Herzegovina | 93.5 /100 | #122 | Exceptional 7.3% |
| Immigrants | Zaire | 93.3 /100 | #123 | Exceptional 7.3% |
| Immigrants | South Africa | 92.5 /100 | #124 | Exceptional 7.3% |
| Pakistanis | 92.2 /100 | #125 | Exceptional 7.3% |
| Immigrants | Burma/Myanmar | 91.9 /100 | #126 | Exceptional 7.3% |
| Jordanians | 91.5 /100 | #127 | Exceptional 7.3% |
| Zimbabweans | 91.5 /100 | #128 | Exceptional 7.3% |
| Slovenes | 89.2 /100 | #129 | Excellent 7.4% |
| Swedes | 88.4 /100 | #130 | Excellent 7.4% |
| Ukrainians | 88.2 /100 | #131 | Excellent 7.4% |
| Immigrants | Armenia | 87.4 /100 | #132 | Excellent 7.4% |
| Immigrants | Uganda | 86.5 /100 | #133 | Excellent 7.4% |
| Immigrants | Bolivia | 85.7 /100 | #134 | Excellent 7.4% |
| Immigrants | Northern Africa | 85.3 /100 | #135 | Excellent 7.4% |