Immigrants from Ethiopia vs Spanish American Unemployment Among Women with Children Under 18 years
COMPARE
Immigrants from Ethiopia
Spanish American
Unemployment Among Women with Children Under 18 years
Unemployment Among Women with Children Under 18 years Comparison
Immigrants from Ethiopia
Spanish Americans
5.3%
UNEMPLOYMENT AMONG WOMEN WITH CHILDREN UNDER 18 YEARS
81.4/ 100
METRIC RATING
132nd/ 347
METRIC RANK
5.8%
UNEMPLOYMENT AMONG WOMEN WITH CHILDREN UNDER 18 YEARS
3.1/ 100
METRIC RATING
233rd/ 347
METRIC RANK
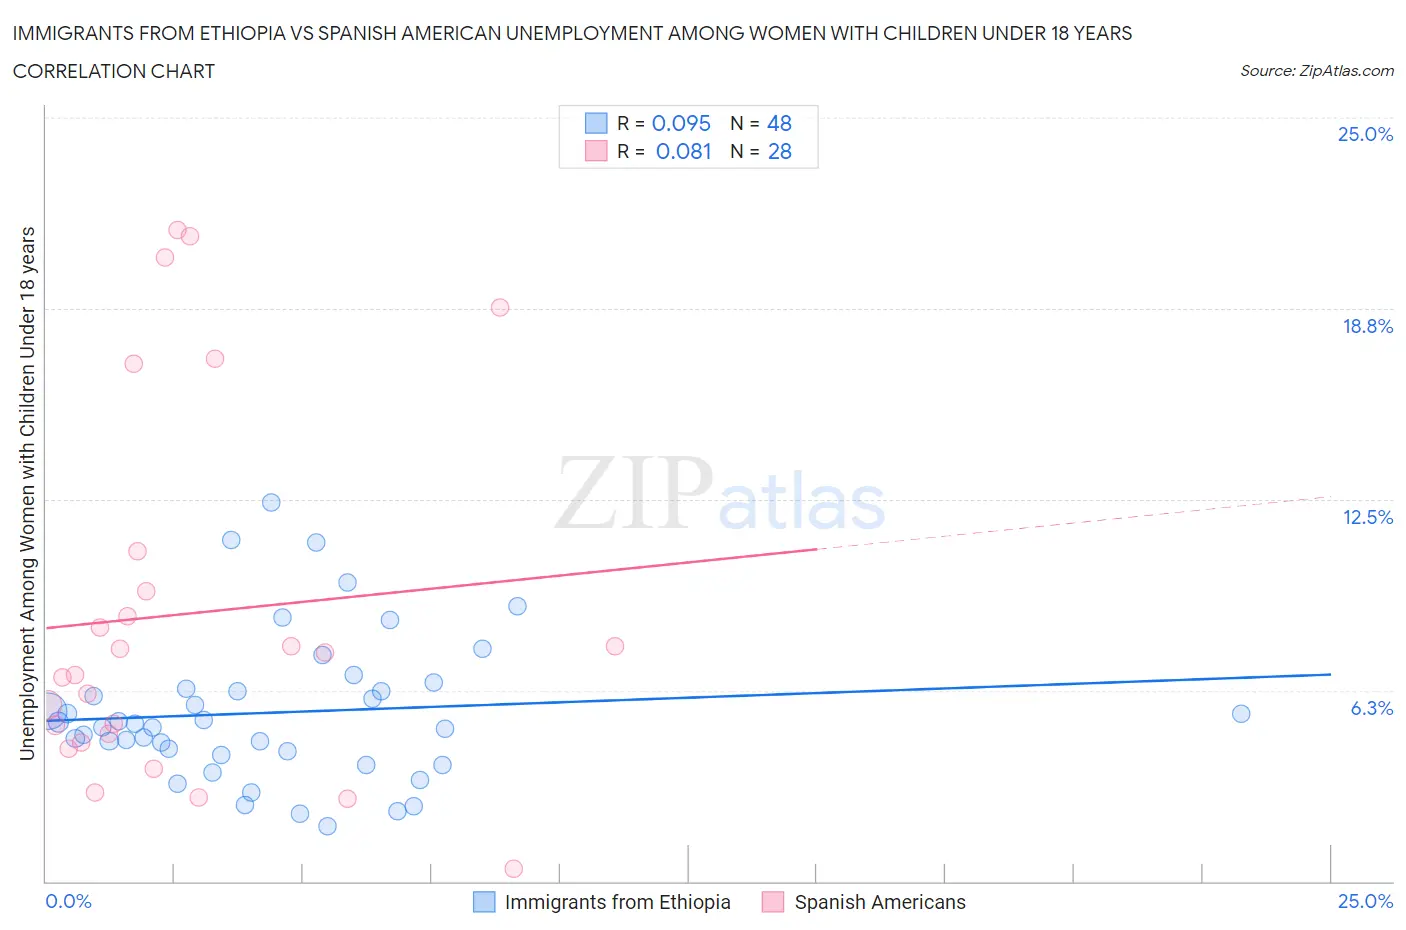
Immigrants from Ethiopia vs Spanish American Unemployment Among Women with Children Under 18 years Correlation Chart
The statistical analysis conducted on geographies consisting of 207,951,626 people shows a slight positive correlation between the proportion of Immigrants from Ethiopia and unemployment rate among women with children under the age of 18 in the United States with a correlation coefficient (R) of 0.095 and weighted average of 5.3%. Similarly, the statistical analysis conducted on geographies consisting of 101,927,595 people shows a slight positive correlation between the proportion of Spanish Americans and unemployment rate among women with children under the age of 18 in the United States with a correlation coefficient (R) of 0.081 and weighted average of 5.8%, a difference of 9.0%.
Unemployment Among Women with Children Under 18 years Correlation Summary
| Measurement | Immigrants from Ethiopia | Spanish American |
| Minimum | 1.8% | 0.40% |
| Maximum | 12.4% | 21.3% |
| Range | 10.6% | 20.9% |
| Mean | 5.5% | 8.8% |
| Median | 5.1% | 7.1% |
| Interquartile 25% (IQ1) | 4.2% | 4.7% |
| Interquartile 75% (IQ3) | 6.3% | 10.1% |
| Interquartile Range (IQR) | 2.1% | 5.5% |
| Standard Deviation (Sample) | 2.4% | 6.1% |
| Standard Deviation (Population) | 2.3% | 6.0% |
Similar Demographics by Unemployment Among Women with Children Under 18 years
Demographics Similar to Immigrants from Ethiopia by Unemployment Among Women with Children Under 18 years
In terms of unemployment among women with children under 18 years, the demographic groups most similar to Immigrants from Ethiopia are Immigrants from Israel (5.3%, a difference of 0.070%), Ethiopian (5.3%, a difference of 0.080%), Immigrants from Austria (5.3%, a difference of 0.090%), Slovak (5.3%, a difference of 0.11%), and Immigrants from Italy (5.3%, a difference of 0.12%).
| Demographics | Rating | Rank | Unemployment Among Women with Children Under 18 years |
| Immigrants | North Macedonia | 83.2 /100 | #125 | Excellent 5.3% |
| Immigrants | Oceania | 83.1 /100 | #126 | Excellent 5.3% |
| Whites/Caucasians | 82.9 /100 | #127 | Excellent 5.3% |
| Immigrants | South Africa | 82.8 /100 | #128 | Excellent 5.3% |
| Immigrants | Italy | 82.3 /100 | #129 | Excellent 5.3% |
| Immigrants | Austria | 82.1 /100 | #130 | Excellent 5.3% |
| Immigrants | Israel | 81.9 /100 | #131 | Excellent 5.3% |
| Immigrants | Ethiopia | 81.4 /100 | #132 | Excellent 5.3% |
| Ethiopians | 80.7 /100 | #133 | Excellent 5.3% |
| Slovaks | 80.5 /100 | #134 | Excellent 5.3% |
| New Zealanders | 79.9 /100 | #135 | Good 5.3% |
| Immigrants | Jordan | 79.5 /100 | #136 | Good 5.3% |
| Jordanians | 78.8 /100 | #137 | Good 5.3% |
| Argentineans | 78.8 /100 | #138 | Good 5.3% |
| Immigrants | Ukraine | 78.5 /100 | #139 | Good 5.3% |
Demographics Similar to Spanish Americans by Unemployment Among Women with Children Under 18 years
In terms of unemployment among women with children under 18 years, the demographic groups most similar to Spanish Americans are Creek (5.8%, a difference of 0.020%), Immigrants from Africa (5.8%, a difference of 0.050%), Immigrants from South America (5.8%, a difference of 0.11%), Guamanian/Chamorro (5.8%, a difference of 0.11%), and Immigrants from Middle Africa (5.8%, a difference of 0.14%).
| Demographics | Rating | Rank | Unemployment Among Women with Children Under 18 years |
| Cherokee | 4.3 /100 | #226 | Tragic 5.7% |
| Sierra Leoneans | 3.8 /100 | #227 | Tragic 5.8% |
| Somalis | 3.5 /100 | #228 | Tragic 5.8% |
| Immigrants | Panama | 3.4 /100 | #229 | Tragic 5.8% |
| Immigrants | South America | 3.2 /100 | #230 | Tragic 5.8% |
| Immigrants | Africa | 3.1 /100 | #231 | Tragic 5.8% |
| Creek | 3.1 /100 | #232 | Tragic 5.8% |
| Spanish Americans | 3.1 /100 | #233 | Tragic 5.8% |
| Guamanians/Chamorros | 2.9 /100 | #234 | Tragic 5.8% |
| Immigrants | Middle Africa | 2.8 /100 | #235 | Tragic 5.8% |
| Alsatians | 2.5 /100 | #236 | Tragic 5.8% |
| Immigrants | Lebanon | 2.4 /100 | #237 | Tragic 5.8% |
| Immigrants | Somalia | 2.2 /100 | #238 | Tragic 5.8% |
| Immigrants | Sierra Leone | 2.0 /100 | #239 | Tragic 5.8% |
| Immigrants | Immigrants | 2.0 /100 | #240 | Tragic 5.8% |