Immigrants from Ethiopia vs Nepalese Unemployment Among Ages 55 to 59 years
COMPARE
Immigrants from Ethiopia
Nepalese
Unemployment Among Ages 55 to 59 years
Unemployment Among Ages 55 to 59 years Comparison
Immigrants from Ethiopia
Nepalese
4.5%
UNEMPLOYMENT AMONG AGES 55 TO 59 YEARS
99.9/ 100
METRIC RATING
32nd/ 347
METRIC RANK
5.6%
UNEMPLOYMENT AMONG AGES 55 TO 59 YEARS
0.0/ 100
METRIC RATING
309th/ 347
METRIC RANK
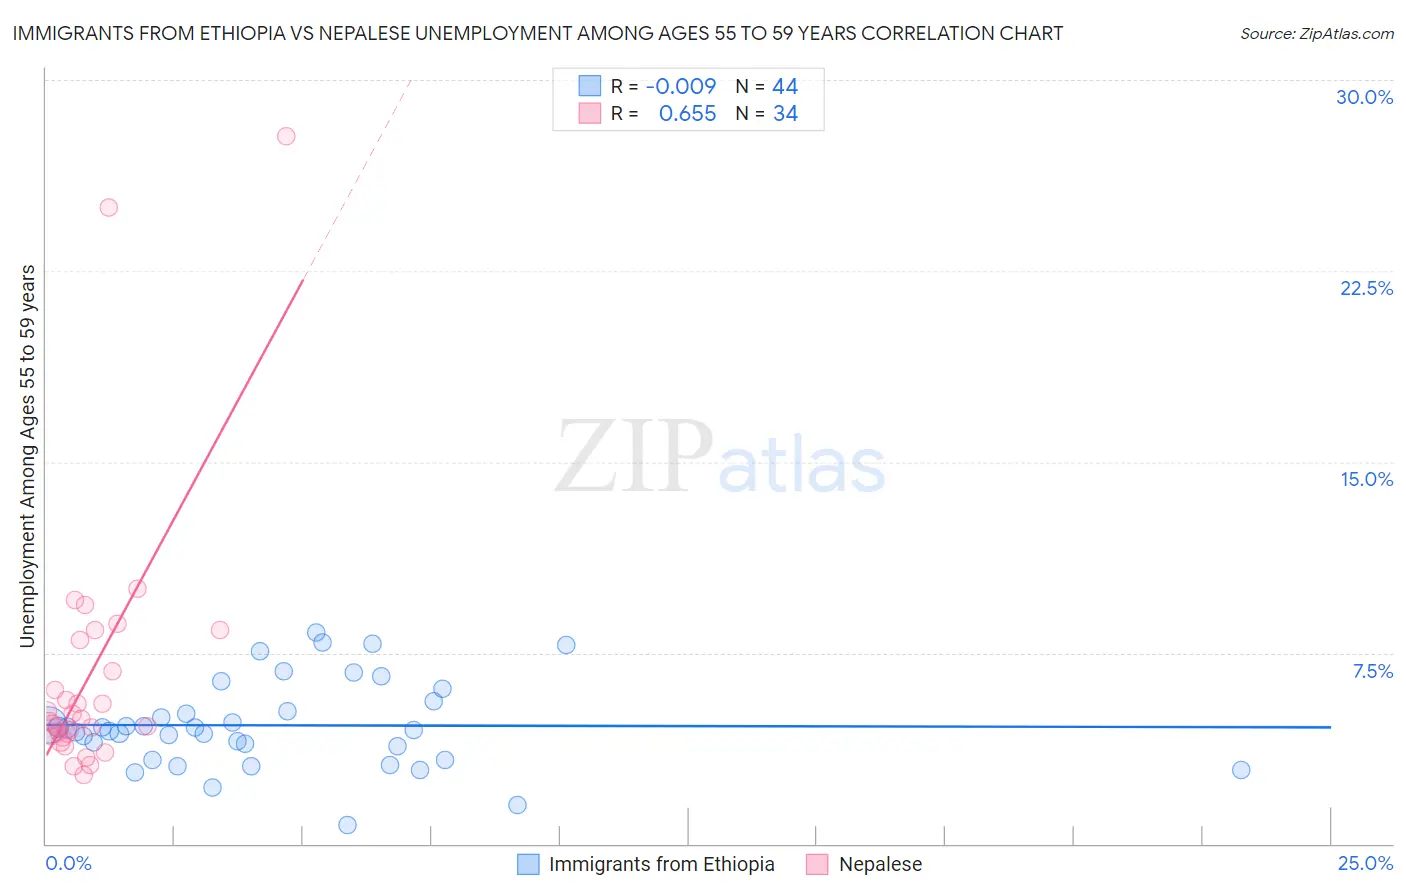
Immigrants from Ethiopia vs Nepalese Unemployment Among Ages 55 to 59 years Correlation Chart
The statistical analysis conducted on geographies consisting of 203,187,895 people shows no correlation between the proportion of Immigrants from Ethiopia and unemployment rate among population between the ages 55 and 59 in the United States with a correlation coefficient (R) of -0.009 and weighted average of 4.5%. Similarly, the statistical analysis conducted on geographies consisting of 24,263,470 people shows a significant positive correlation between the proportion of Nepalese and unemployment rate among population between the ages 55 and 59 in the United States with a correlation coefficient (R) of 0.655 and weighted average of 5.6%, a difference of 25.1%.
Unemployment Among Ages 55 to 59 years Correlation Summary
| Measurement | Immigrants from Ethiopia | Nepalese |
| Minimum | 0.73% | 2.7% |
| Maximum | 8.3% | 27.8% |
| Range | 7.6% | 25.1% |
| Mean | 4.7% | 6.7% |
| Median | 4.5% | 4.9% |
| Interquartile 25% (IQ1) | 3.6% | 4.2% |
| Interquartile 75% (IQ3) | 5.4% | 8.0% |
| Interquartile Range (IQR) | 1.8% | 3.8% |
| Standard Deviation (Sample) | 1.7% | 5.4% |
| Standard Deviation (Population) | 1.7% | 5.3% |
Similar Demographics by Unemployment Among Ages 55 to 59 years
Demographics Similar to Immigrants from Ethiopia by Unemployment Among Ages 55 to 59 years
In terms of unemployment among ages 55 to 59 years, the demographic groups most similar to Immigrants from Ethiopia are Belgian (4.5%, a difference of 0.12%), German (4.5%, a difference of 0.13%), Immigrants from Kenya (4.5%, a difference of 0.20%), Thai (4.5%, a difference of 0.20%), and Cypriot (4.5%, a difference of 0.21%).
| Demographics | Rating | Rank | Unemployment Among Ages 55 to 59 years |
| Immigrants | Eritrea | 100.0 /100 | #25 | Exceptional 4.4% |
| Scandinavians | 99.9 /100 | #26 | Exceptional 4.5% |
| Immigrants | Zimbabwe | 99.9 /100 | #27 | Exceptional 4.5% |
| Immigrants | Eastern Africa | 99.9 /100 | #28 | Exceptional 4.5% |
| Palestinians | 99.9 /100 | #29 | Exceptional 4.5% |
| Immigrants | Kenya | 99.9 /100 | #30 | Exceptional 4.5% |
| Germans | 99.9 /100 | #31 | Exceptional 4.5% |
| Immigrants | Ethiopia | 99.9 /100 | #32 | Exceptional 4.5% |
| Belgians | 99.9 /100 | #33 | Exceptional 4.5% |
| Thais | 99.9 /100 | #34 | Exceptional 4.5% |
| Cypriots | 99.9 /100 | #35 | Exceptional 4.5% |
| Ethiopians | 99.9 /100 | #36 | Exceptional 4.5% |
| Immigrants | Bulgaria | 99.9 /100 | #37 | Exceptional 4.5% |
| Assyrians/Chaldeans/Syriacs | 99.9 /100 | #38 | Exceptional 4.5% |
| English | 99.9 /100 | #39 | Exceptional 4.5% |
Demographics Similar to Nepalese by Unemployment Among Ages 55 to 59 years
In terms of unemployment among ages 55 to 59 years, the demographic groups most similar to Nepalese are Belizean (5.6%, a difference of 0.44%), Spanish American Indian (5.6%, a difference of 0.58%), Houma (5.6%, a difference of 0.62%), Ecuadorian (5.6%, a difference of 0.84%), and Central American Indian (5.6%, a difference of 1.0%).
| Demographics | Rating | Rank | Unemployment Among Ages 55 to 59 years |
| Sierra Leoneans | 0.0 /100 | #302 | Tragic 5.5% |
| Marshallese | 0.0 /100 | #303 | Tragic 5.5% |
| Blacks/African Americans | 0.0 /100 | #304 | Tragic 5.5% |
| Immigrants | Portugal | 0.0 /100 | #305 | Tragic 5.5% |
| Immigrants | Cabo Verde | 0.0 /100 | #306 | Tragic 5.5% |
| Immigrants | Belize | 0.0 /100 | #307 | Tragic 5.5% |
| Spanish American Indians | 0.0 /100 | #308 | Tragic 5.6% |
| Nepalese | 0.0 /100 | #309 | Tragic 5.6% |
| Belizeans | 0.0 /100 | #310 | Tragic 5.6% |
| Houma | 0.0 /100 | #311 | Tragic 5.6% |
| Ecuadorians | 0.0 /100 | #312 | Tragic 5.6% |
| Central American Indians | 0.0 /100 | #313 | Tragic 5.6% |
| Tlingit-Haida | 0.0 /100 | #314 | Tragic 5.7% |
| Guyanese | 0.0 /100 | #315 | Tragic 5.7% |
| Immigrants | Ecuador | 0.0 /100 | #316 | Tragic 5.7% |