Immigrants from Eritrea vs Senegalese Unemployment Among Ages 65 to 74 years
COMPARE
Immigrants from Eritrea
Senegalese
Unemployment Among Ages 65 to 74 years
Unemployment Among Ages 65 to 74 years Comparison
Immigrants from Eritrea
Senegalese
4.9%
UNEMPLOYMENT AMONG AGES 65 TO 74 YEARS
100.0/ 100
METRIC RATING
21st/ 347
METRIC RANK
5.2%
UNEMPLOYMENT AMONG AGES 65 TO 74 YEARS
96.5/ 100
METRIC RATING
97th/ 347
METRIC RANK
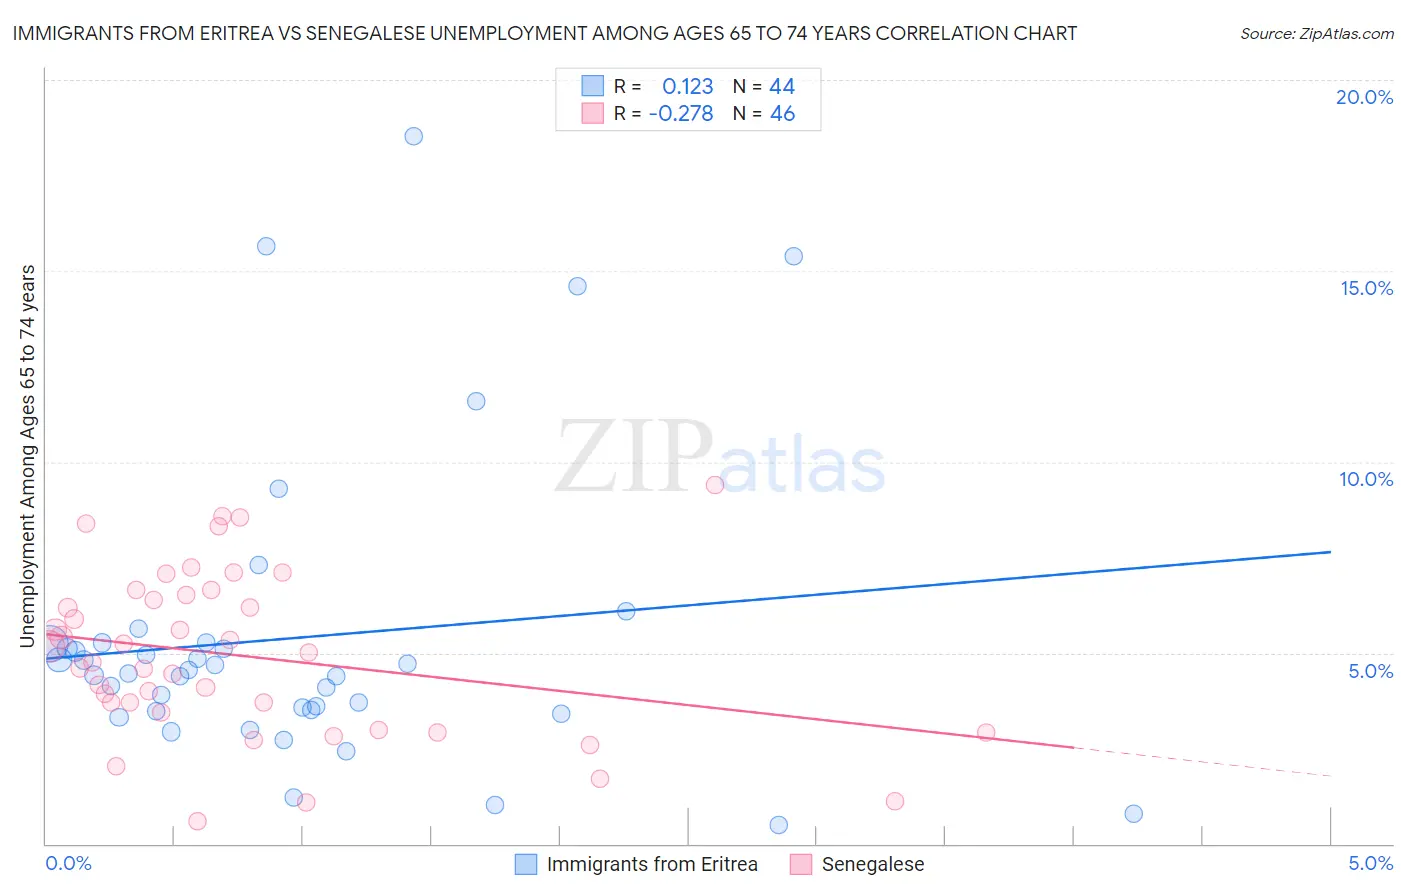
Immigrants from Eritrea vs Senegalese Unemployment Among Ages 65 to 74 years Correlation Chart
The statistical analysis conducted on geographies consisting of 101,478,319 people shows a poor positive correlation between the proportion of Immigrants from Eritrea and unemployment rate among population between the ages 65 and 74 in the United States with a correlation coefficient (R) of 0.123 and weighted average of 4.9%. Similarly, the statistical analysis conducted on geographies consisting of 75,763,362 people shows a weak negative correlation between the proportion of Senegalese and unemployment rate among population between the ages 65 and 74 in the United States with a correlation coefficient (R) of -0.278 and weighted average of 5.2%, a difference of 7.4%.
Unemployment Among Ages 65 to 74 years Correlation Summary
| Measurement | Immigrants from Eritrea | Senegalese |
| Minimum | 0.50% | 0.60% |
| Maximum | 18.5% | 9.4% |
| Range | 18.0% | 8.8% |
| Mean | 5.4% | 4.9% |
| Median | 4.5% | 4.9% |
| Interquartile 25% (IQ1) | 3.5% | 3.4% |
| Interquartile 75% (IQ3) | 5.2% | 6.5% |
| Interquartile Range (IQR) | 1.7% | 3.1% |
| Standard Deviation (Sample) | 3.9% | 2.2% |
| Standard Deviation (Population) | 3.9% | 2.1% |
Similar Demographics by Unemployment Among Ages 65 to 74 years
Demographics Similar to Immigrants from Eritrea by Unemployment Among Ages 65 to 74 years
In terms of unemployment among ages 65 to 74 years, the demographic groups most similar to Immigrants from Eritrea are Immigrants from Zaire (4.8%, a difference of 0.38%), Menominee (4.8%, a difference of 0.64%), Creek (4.8%, a difference of 0.69%), Lebanese (4.9%, a difference of 0.75%), and Kenyan (4.8%, a difference of 0.76%).
| Demographics | Rating | Rank | Unemployment Among Ages 65 to 74 years |
| Cubans | 100.0 /100 | #14 | Exceptional 4.8% |
| Immigrants | North Macedonia | 100.0 /100 | #15 | Exceptional 4.8% |
| Immigrants | Burma/Myanmar | 100.0 /100 | #16 | Exceptional 4.8% |
| Kenyans | 100.0 /100 | #17 | Exceptional 4.8% |
| Creek | 100.0 /100 | #18 | Exceptional 4.8% |
| Menominee | 100.0 /100 | #19 | Exceptional 4.8% |
| Immigrants | Zaire | 100.0 /100 | #20 | Exceptional 4.8% |
| Immigrants | Eritrea | 100.0 /100 | #21 | Exceptional 4.9% |
| Lebanese | 100.0 /100 | #22 | Exceptional 4.9% |
| Immigrants | Nepal | 100.0 /100 | #23 | Exceptional 4.9% |
| Iraqis | 100.0 /100 | #24 | Exceptional 4.9% |
| Macedonians | 100.0 /100 | #25 | Exceptional 5.0% |
| Czechs | 100.0 /100 | #26 | Exceptional 5.0% |
| Norwegians | 100.0 /100 | #27 | Exceptional 5.0% |
| Bulgarians | 100.0 /100 | #28 | Exceptional 5.0% |
Demographics Similar to Senegalese by Unemployment Among Ages 65 to 74 years
In terms of unemployment among ages 65 to 74 years, the demographic groups most similar to Senegalese are Welsh (5.2%, a difference of 0.010%), Burmese (5.2%, a difference of 0.030%), Japanese (5.2%, a difference of 0.040%), Immigrants from Cambodia (5.2%, a difference of 0.050%), and Immigrants from Thailand (5.2%, a difference of 0.12%).
| Demographics | Rating | Rank | Unemployment Among Ages 65 to 74 years |
| Luxembourgers | 97.6 /100 | #90 | Exceptional 5.2% |
| Romanians | 97.4 /100 | #91 | Exceptional 5.2% |
| Puget Sound Salish | 97.3 /100 | #92 | Exceptional 5.2% |
| Immigrants | Netherlands | 97.1 /100 | #93 | Exceptional 5.2% |
| South Africans | 97.1 /100 | #94 | Exceptional 5.2% |
| Serbians | 97.0 /100 | #95 | Exceptional 5.2% |
| Immigrants | Thailand | 97.0 /100 | #96 | Exceptional 5.2% |
| Senegalese | 96.5 /100 | #97 | Exceptional 5.2% |
| Welsh | 96.5 /100 | #98 | Exceptional 5.2% |
| Burmese | 96.4 /100 | #99 | Exceptional 5.2% |
| Japanese | 96.4 /100 | #100 | Exceptional 5.2% |
| Immigrants | Cambodia | 96.3 /100 | #101 | Exceptional 5.2% |
| Immigrants | Lithuania | 95.9 /100 | #102 | Exceptional 5.2% |
| Immigrants | Vietnam | 95.6 /100 | #103 | Exceptional 5.2% |
| Yugoslavians | 95.5 /100 | #104 | Exceptional 5.2% |