Immigrants from Eritrea vs Australian Unemployment Among Ages 16 to 19 years
COMPARE
Immigrants from Eritrea
Australian
Unemployment Among Ages 16 to 19 years
Unemployment Among Ages 16 to 19 years Comparison
Immigrants from Eritrea
Australians
17.3%
UNEMPLOYMENT AMONG AGES 16 TO 19 YEARS
81.1/ 100
METRIC RATING
139th/ 347
METRIC RANK
17.2%
UNEMPLOYMENT AMONG AGES 16 TO 19 YEARS
85.6/ 100
METRIC RATING
128th/ 347
METRIC RANK
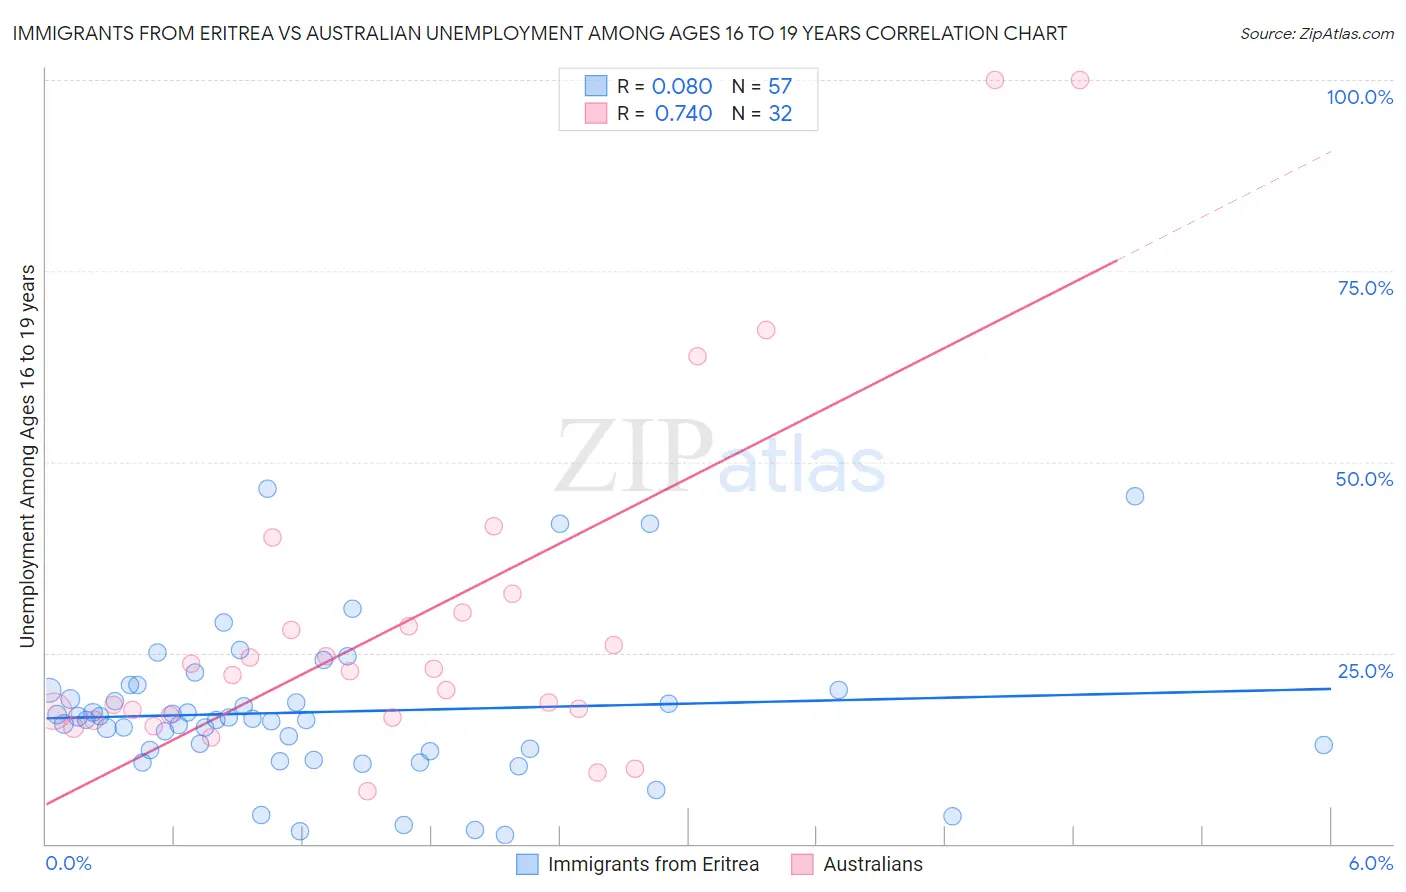
Immigrants from Eritrea vs Australian Unemployment Among Ages 16 to 19 years Correlation Chart
The statistical analysis conducted on geographies consisting of 103,486,787 people shows a slight positive correlation between the proportion of Immigrants from Eritrea and unemployment rate among population between the ages 16 and 19 in the United States with a correlation coefficient (R) of 0.080 and weighted average of 17.3%. Similarly, the statistical analysis conducted on geographies consisting of 215,939,748 people shows a strong positive correlation between the proportion of Australians and unemployment rate among population between the ages 16 and 19 in the United States with a correlation coefficient (R) of 0.740 and weighted average of 17.2%, a difference of 0.39%.
Unemployment Among Ages 16 to 19 years Correlation Summary
| Measurement | Immigrants from Eritrea | Australian |
| Minimum | 1.1% | 6.9% |
| Maximum | 46.5% | 100.0% |
| Range | 45.4% | 93.1% |
| Mean | 17.3% | 29.0% |
| Median | 16.2% | 22.4% |
| Interquartile 25% (IQ1) | 12.2% | 16.6% |
| Interquartile 75% (IQ3) | 20.1% | 29.4% |
| Interquartile Range (IQR) | 7.9% | 12.8% |
| Standard Deviation (Sample) | 9.8% | 22.9% |
| Standard Deviation (Population) | 9.7% | 22.6% |
Demographics Similar to Immigrants from Eritrea and Australians by Unemployment Among Ages 16 to 19 years
In terms of unemployment among ages 16 to 19 years, the demographic groups most similar to Immigrants from Eritrea are Immigrants from Croatia (17.3%, a difference of 0.020%), Basque (17.3%, a difference of 0.030%), Bolivian (17.3%, a difference of 0.070%), Immigrants from Malaysia (17.2%, a difference of 0.14%), and Spanish (17.3%, a difference of 0.14%). Similarly, the demographic groups most similar to Australians are Creek (17.2%, a difference of 0.010%), Pakistani (17.2%, a difference of 0.020%), Immigrants from Indonesia (17.2%, a difference of 0.090%), Immigrants from Bolivia (17.2%, a difference of 0.12%), and German Russian (17.2%, a difference of 0.14%).
| Demographics | Rating | Rank | Unemployment Among Ages 16 to 19 years |
| Immigrants | Laos | 88.8 /100 | #123 | Excellent 17.1% |
| Syrians | 88.6 /100 | #124 | Excellent 17.1% |
| Immigrants | Germany | 87.7 /100 | #125 | Excellent 17.2% |
| Immigrants | Bolivia | 86.7 /100 | #126 | Excellent 17.2% |
| Pakistanis | 85.8 /100 | #127 | Excellent 17.2% |
| Australians | 85.6 /100 | #128 | Excellent 17.2% |
| Creek | 85.5 /100 | #129 | Excellent 17.2% |
| Immigrants | Indonesia | 84.7 /100 | #130 | Excellent 17.2% |
| German Russians | 84.1 /100 | #131 | Excellent 17.2% |
| Arabs | 83.9 /100 | #132 | Excellent 17.2% |
| Laotians | 83.9 /100 | #133 | Excellent 17.2% |
| Potawatomi | 83.8 /100 | #134 | Excellent 17.2% |
| Samoans | 83.7 /100 | #135 | Excellent 17.2% |
| Immigrants | Oceania | 83.1 /100 | #136 | Excellent 17.2% |
| Immigrants | Malaysia | 82.8 /100 | #137 | Excellent 17.2% |
| Bolivians | 81.9 /100 | #138 | Excellent 17.3% |
| Immigrants | Eritrea | 81.1 /100 | #139 | Excellent 17.3% |
| Immigrants | Croatia | 80.8 /100 | #140 | Excellent 17.3% |
| Basques | 80.7 /100 | #141 | Excellent 17.3% |
| Spanish | 79.3 /100 | #142 | Good 17.3% |
| Immigrants | Egypt | 79.1 /100 | #143 | Good 17.3% |