Immigrants from England vs Ukrainian Unemployment Among Ages 45 to 54 years
COMPARE
Immigrants from England
Ukrainian
Unemployment Among Ages 45 to 54 years
Unemployment Among Ages 45 to 54 years Comparison
Immigrants from England
Ukrainians
4.4%
UNEMPLOYMENT AMONG AGES 45 TO 54 YEARS
91.3/ 100
METRIC RATING
110th/ 347
METRIC RANK
4.3%
UNEMPLOYMENT AMONG AGES 45 TO 54 YEARS
96.6/ 100
METRIC RATING
91st/ 347
METRIC RANK
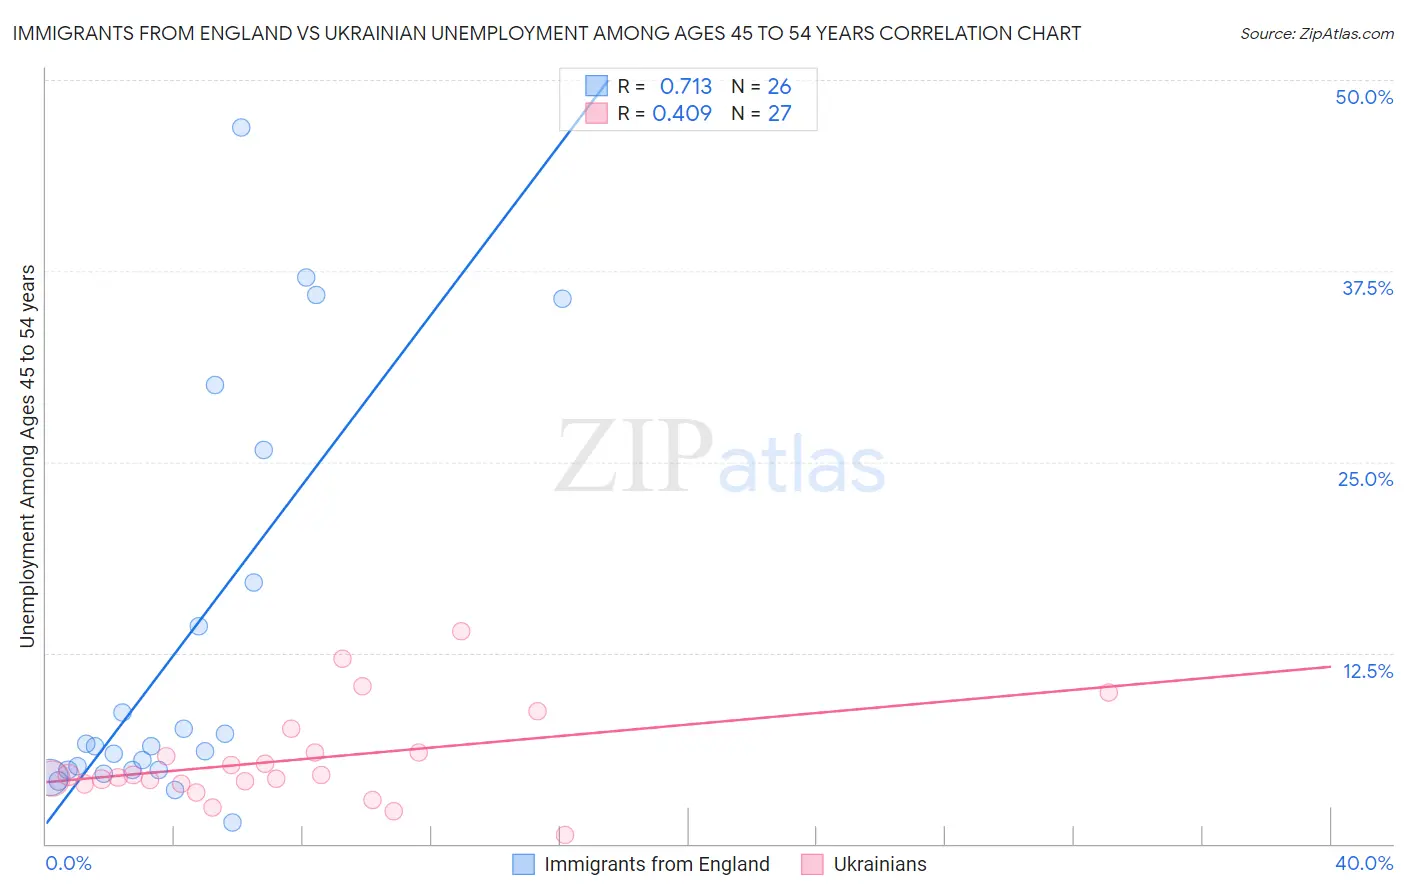
Immigrants from England vs Ukrainian Unemployment Among Ages 45 to 54 years Correlation Chart
The statistical analysis conducted on geographies consisting of 381,390,957 people shows a strong positive correlation between the proportion of Immigrants from England and unemployment rate among population between the ages 45 and 54 in the United States with a correlation coefficient (R) of 0.713 and weighted average of 4.4%. Similarly, the statistical analysis conducted on geographies consisting of 431,357,749 people shows a moderate positive correlation between the proportion of Ukrainians and unemployment rate among population between the ages 45 and 54 in the United States with a correlation coefficient (R) of 0.409 and weighted average of 4.3%, a difference of 1.2%.
Unemployment Among Ages 45 to 54 years Correlation Summary
| Measurement | Immigrants from England | Ukrainian |
| Minimum | 1.4% | 0.60% |
| Maximum | 46.9% | 13.9% |
| Range | 45.5% | 13.3% |
| Mean | 13.1% | 5.5% |
| Median | 6.4% | 4.5% |
| Interquartile 25% (IQ1) | 4.8% | 3.9% |
| Interquartile 75% (IQ3) | 17.1% | 6.0% |
| Interquartile Range (IQR) | 12.3% | 2.0% |
| Standard Deviation (Sample) | 13.1% | 3.1% |
| Standard Deviation (Population) | 12.9% | 3.0% |
Demographics Similar to Immigrants from England and Ukrainians by Unemployment Among Ages 45 to 54 years
In terms of unemployment among ages 45 to 54 years, the demographic groups most similar to Immigrants from England are New Zealander (4.4%, a difference of 0.10%), Russian (4.4%, a difference of 0.12%), Iranian (4.4%, a difference of 0.19%), Immigrants from South Africa (4.4%, a difference of 0.19%), and Immigrants from Kenya (4.4%, a difference of 0.25%). Similarly, the demographic groups most similar to Ukrainians are Mongolian (4.3%, a difference of 0.020%), Argentinean (4.3%, a difference of 0.040%), Asian (4.3%, a difference of 0.070%), Immigrants from Malaysia (4.4%, a difference of 0.16%), and Immigrants from Ethiopia (4.4%, a difference of 0.19%).
| Demographics | Rating | Rank | Unemployment Among Ages 45 to 54 years |
| Asians | 96.8 /100 | #90 | Exceptional 4.3% |
| Ukrainians | 96.6 /100 | #91 | Exceptional 4.3% |
| Mongolians | 96.6 /100 | #92 | Exceptional 4.3% |
| Argentineans | 96.5 /100 | #93 | Exceptional 4.3% |
| Immigrants | Malaysia | 96.2 /100 | #94 | Exceptional 4.4% |
| Immigrants | Ethiopia | 96.1 /100 | #95 | Exceptional 4.4% |
| Indonesians | 95.4 /100 | #96 | Exceptional 4.4% |
| Immigrants | Canada | 95.0 /100 | #97 | Exceptional 4.4% |
| Romanians | 94.9 /100 | #98 | Exceptional 4.4% |
| Immigrants | Burma/Myanmar | 94.9 /100 | #99 | Exceptional 4.4% |
| Immigrants | Eritrea | 94.7 /100 | #100 | Exceptional 4.4% |
| Immigrants | North America | 93.9 /100 | #101 | Exceptional 4.4% |
| Sri Lankans | 93.7 /100 | #102 | Exceptional 4.4% |
| Icelanders | 93.5 /100 | #103 | Exceptional 4.4% |
| Immigrants | Sweden | 93.0 /100 | #104 | Exceptional 4.4% |
| Immigrants | Kenya | 92.8 /100 | #105 | Exceptional 4.4% |
| Iranians | 92.5 /100 | #106 | Exceptional 4.4% |
| Immigrants | South Africa | 92.5 /100 | #107 | Exceptional 4.4% |
| Russians | 92.1 /100 | #108 | Exceptional 4.4% |
| New Zealanders | 91.9 /100 | #109 | Exceptional 4.4% |
| Immigrants | England | 91.3 /100 | #110 | Exceptional 4.4% |