Immigrants from England vs Somali Unemployment Among Ages 60 to 64 years
COMPARE
Immigrants from England
Somali
Unemployment Among Ages 60 to 64 years
Unemployment Among Ages 60 to 64 years Comparison
Immigrants from England
Somalis
4.7%
UNEMPLOYMENT AMONG AGES 60 TO 64 YEARS
96.3/ 100
METRIC RATING
116th/ 347
METRIC RANK
4.7%
UNEMPLOYMENT AMONG AGES 60 TO 64 YEARS
98.0/ 100
METRIC RATING
98th/ 347
METRIC RANK
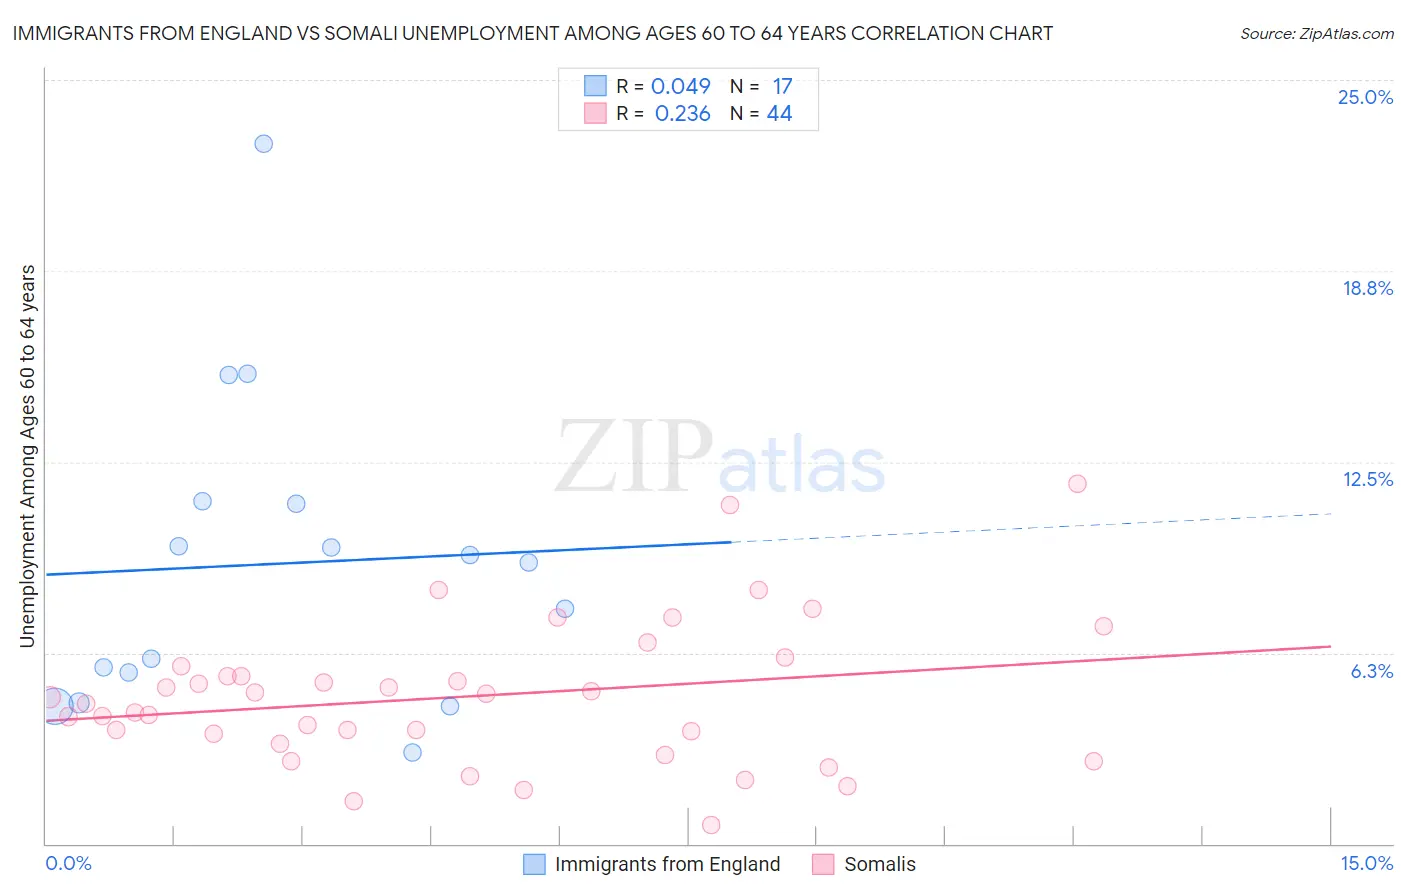
Immigrants from England vs Somali Unemployment Among Ages 60 to 64 years Correlation Chart
The statistical analysis conducted on geographies consisting of 354,085,552 people shows no correlation between the proportion of Immigrants from England and unemployment rate among population between the ages 60 and 64 in the United States with a correlation coefficient (R) of 0.049 and weighted average of 4.7%. Similarly, the statistical analysis conducted on geographies consisting of 96,063,550 people shows a weak positive correlation between the proportion of Somalis and unemployment rate among population between the ages 60 and 64 in the United States with a correlation coefficient (R) of 0.236 and weighted average of 4.7%, a difference of 0.57%.
Unemployment Among Ages 60 to 64 years Correlation Summary
| Measurement | Immigrants from England | Somali |
| Minimum | 3.0% | 0.60% |
| Maximum | 22.9% | 11.8% |
| Range | 19.9% | 11.2% |
| Mean | 9.2% | 4.8% |
| Median | 9.2% | 4.7% |
| Interquartile 25% (IQ1) | 5.1% | 3.4% |
| Interquartile 75% (IQ3) | 11.2% | 5.7% |
| Interquartile Range (IQR) | 6.1% | 2.2% |
| Standard Deviation (Sample) | 5.1% | 2.3% |
| Standard Deviation (Population) | 4.9% | 2.3% |
Demographics Similar to Immigrants from England and Somalis by Unemployment Among Ages 60 to 64 years
In terms of unemployment among ages 60 to 64 years, the demographic groups most similar to Immigrants from England are Immigrants from Germany (4.7%, a difference of 0.0%), Immigrants from Romania (4.7%, a difference of 0.040%), Bulgarian (4.7%, a difference of 0.070%), Maltese (4.7%, a difference of 0.070%), and Syrian (4.7%, a difference of 0.19%). Similarly, the demographic groups most similar to Somalis are Immigrants from Albania (4.7%, a difference of 0.0%), Egyptian (4.7%, a difference of 0.010%), Portuguese (4.7%, a difference of 0.040%), Malaysian (4.7%, a difference of 0.050%), and Immigrants from Canada (4.7%, a difference of 0.060%).
| Demographics | Rating | Rank | Unemployment Among Ages 60 to 64 years |
| Immigrants | Albania | 98.0 /100 | #97 | Exceptional 4.7% |
| Somalis | 98.0 /100 | #98 | Exceptional 4.7% |
| Egyptians | 98.0 /100 | #99 | Exceptional 4.7% |
| Portuguese | 97.9 /100 | #100 | Exceptional 4.7% |
| Malaysians | 97.9 /100 | #101 | Exceptional 4.7% |
| Immigrants | Canada | 97.8 /100 | #102 | Exceptional 4.7% |
| Whites/Caucasians | 97.8 /100 | #103 | Exceptional 4.7% |
| Paraguayans | 97.7 /100 | #104 | Exceptional 4.7% |
| Canadians | 97.7 /100 | #105 | Exceptional 4.7% |
| Immigrants | North America | 97.6 /100 | #106 | Exceptional 4.7% |
| Greeks | 97.5 /100 | #107 | Exceptional 4.7% |
| Immigrants | Japan | 97.4 /100 | #108 | Exceptional 4.7% |
| Immigrants | Netherlands | 97.4 /100 | #109 | Exceptional 4.7% |
| Ethiopians | 97.2 /100 | #110 | Exceptional 4.7% |
| French | 97.1 /100 | #111 | Exceptional 4.7% |
| Syrians | 97.0 /100 | #112 | Exceptional 4.7% |
| Bulgarians | 96.6 /100 | #113 | Exceptional 4.7% |
| Maltese | 96.5 /100 | #114 | Exceptional 4.7% |
| Immigrants | Romania | 96.4 /100 | #115 | Exceptional 4.7% |
| Immigrants | England | 96.3 /100 | #116 | Exceptional 4.7% |
| Immigrants | Germany | 96.3 /100 | #117 | Exceptional 4.7% |