Immigrants from England vs Norwegian Unemployment Among Youth under 25 years
COMPARE
Immigrants from England
Norwegian
Unemployment Among Youth under 25 years
Unemployment Among Youth under 25 years Comparison
Immigrants from England
Norwegians
11.5%
UNEMPLOYMENT AMONG YOUTH UNDER 25 YEARS
78.1/ 100
METRIC RATING
138th/ 347
METRIC RANK
9.8%
UNEMPLOYMENT AMONG YOUTH UNDER 25 YEARS
100.0/ 100
METRIC RATING
1st/ 347
METRIC RANK
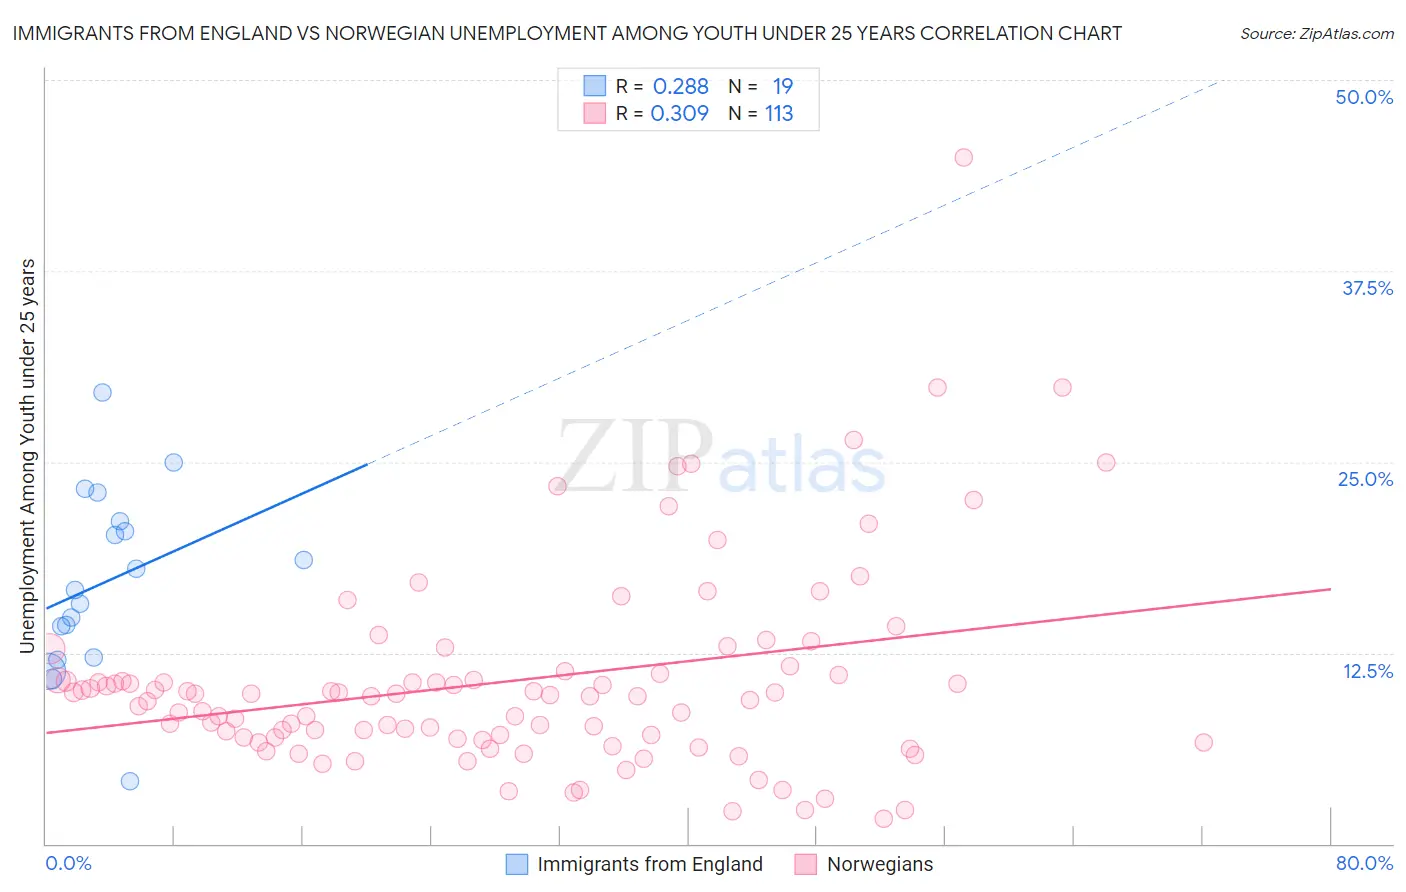
Immigrants from England vs Norwegian Unemployment Among Youth under 25 years Correlation Chart
The statistical analysis conducted on geographies consisting of 386,140,742 people shows a weak positive correlation between the proportion of Immigrants from England and unemployment rate among youth under the age of 25 in the United States with a correlation coefficient (R) of 0.288 and weighted average of 11.5%. Similarly, the statistical analysis conducted on geographies consisting of 514,614,571 people shows a mild positive correlation between the proportion of Norwegians and unemployment rate among youth under the age of 25 in the United States with a correlation coefficient (R) of 0.309 and weighted average of 9.8%, a difference of 16.4%.
Unemployment Among Youth under 25 years Correlation Summary
| Measurement | Immigrants from England | Norwegian |
| Minimum | 4.1% | 1.6% |
| Maximum | 29.5% | 44.9% |
| Range | 25.4% | 43.3% |
| Mean | 17.1% | 10.6% |
| Median | 16.6% | 9.6% |
| Interquartile 25% (IQ1) | 12.2% | 6.9% |
| Interquartile 75% (IQ3) | 21.1% | 11.1% |
| Interquartile Range (IQR) | 8.9% | 4.2% |
| Standard Deviation (Sample) | 6.0% | 6.6% |
| Standard Deviation (Population) | 5.8% | 6.6% |
Similar Demographics by Unemployment Among Youth under 25 years
Demographics Similar to Immigrants from England by Unemployment Among Youth under 25 years
In terms of unemployment among youth under 25 years, the demographic groups most similar to Immigrants from England are Immigrants from Indonesia (11.5%, a difference of 0.030%), Immigrants from Belgium (11.5%, a difference of 0.030%), Asian (11.4%, a difference of 0.10%), Immigrants from Uruguay (11.5%, a difference of 0.12%), and Romanian (11.4%, a difference of 0.13%).
| Demographics | Rating | Rank | Unemployment Among Youth under 25 years |
| Immigrants | Spain | 84.6 /100 | #131 | Excellent 11.4% |
| Ethiopians | 83.2 /100 | #132 | Excellent 11.4% |
| Lebanese | 83.1 /100 | #133 | Excellent 11.4% |
| Immigrants | Chile | 80.4 /100 | #134 | Excellent 11.4% |
| Immigrants | Oceania | 80.2 /100 | #135 | Excellent 11.4% |
| Romanians | 80.1 /100 | #136 | Excellent 11.4% |
| Asians | 79.7 /100 | #137 | Good 11.4% |
| Immigrants | England | 78.1 /100 | #138 | Good 11.5% |
| Immigrants | Indonesia | 77.6 /100 | #139 | Good 11.5% |
| Immigrants | Belgium | 77.5 /100 | #140 | Good 11.5% |
| Immigrants | Uruguay | 76.1 /100 | #141 | Good 11.5% |
| Immigrants | Korea | 75.1 /100 | #142 | Good 11.5% |
| Immigrants | Uganda | 74.5 /100 | #143 | Good 11.5% |
| Immigrants | Brazil | 74.3 /100 | #144 | Good 11.5% |
| Argentineans | 73.0 /100 | #145 | Good 11.5% |
Demographics Similar to Norwegians by Unemployment Among Youth under 25 years
In terms of unemployment among youth under 25 years, the demographic groups most similar to Norwegians are Immigrants from Cuba (10.0%, a difference of 1.6%), Luxembourger (10.0%, a difference of 1.8%), Zimbabwean (10.2%, a difference of 3.5%), Czech (10.3%, a difference of 4.6%), and Danish (10.3%, a difference of 4.8%).
| Demographics | Rating | Rank | Unemployment Among Youth under 25 years |
| Norwegians | 100.0 /100 | #1 | Exceptional 9.8% |
| Immigrants | Cuba | 100.0 /100 | #2 | Exceptional 10.0% |
| Luxembourgers | 100.0 /100 | #3 | Exceptional 10.0% |
| Zimbabweans | 100.0 /100 | #4 | Exceptional 10.2% |
| Czechs | 100.0 /100 | #5 | Exceptional 10.3% |
| Danes | 100.0 /100 | #6 | Exceptional 10.3% |
| Swedes | 100.0 /100 | #7 | Exceptional 10.4% |
| Immigrants | Venezuela | 100.0 /100 | #8 | Exceptional 10.5% |
| Germans | 100.0 /100 | #9 | Exceptional 10.5% |
| Immigrants | Somalia | 100.0 /100 | #10 | Exceptional 10.5% |
| Scandinavians | 100.0 /100 | #11 | Exceptional 10.5% |
| Immigrants | Sudan | 100.0 /100 | #12 | Exceptional 10.5% |
| Indonesians | 100.0 /100 | #13 | Exceptional 10.6% |
| Cubans | 100.0 /100 | #14 | Exceptional 10.6% |
| Sudanese | 100.0 /100 | #15 | Exceptional 10.6% |