Immigrants from El Salvador vs Spanish Unemployment Among Ages 25 to 29 years
COMPARE
Immigrants from El Salvador
Spanish
Unemployment Among Ages 25 to 29 years
Unemployment Among Ages 25 to 29 years Comparison
Immigrants from El Salvador
Spanish
7.0%
UNEMPLOYMENT AMONG AGES 25 TO 29 YEARS
3.6/ 100
METRIC RATING
230th/ 347
METRIC RANK
6.8%
UNEMPLOYMENT AMONG AGES 25 TO 29 YEARS
14.4/ 100
METRIC RATING
215th/ 347
METRIC RANK
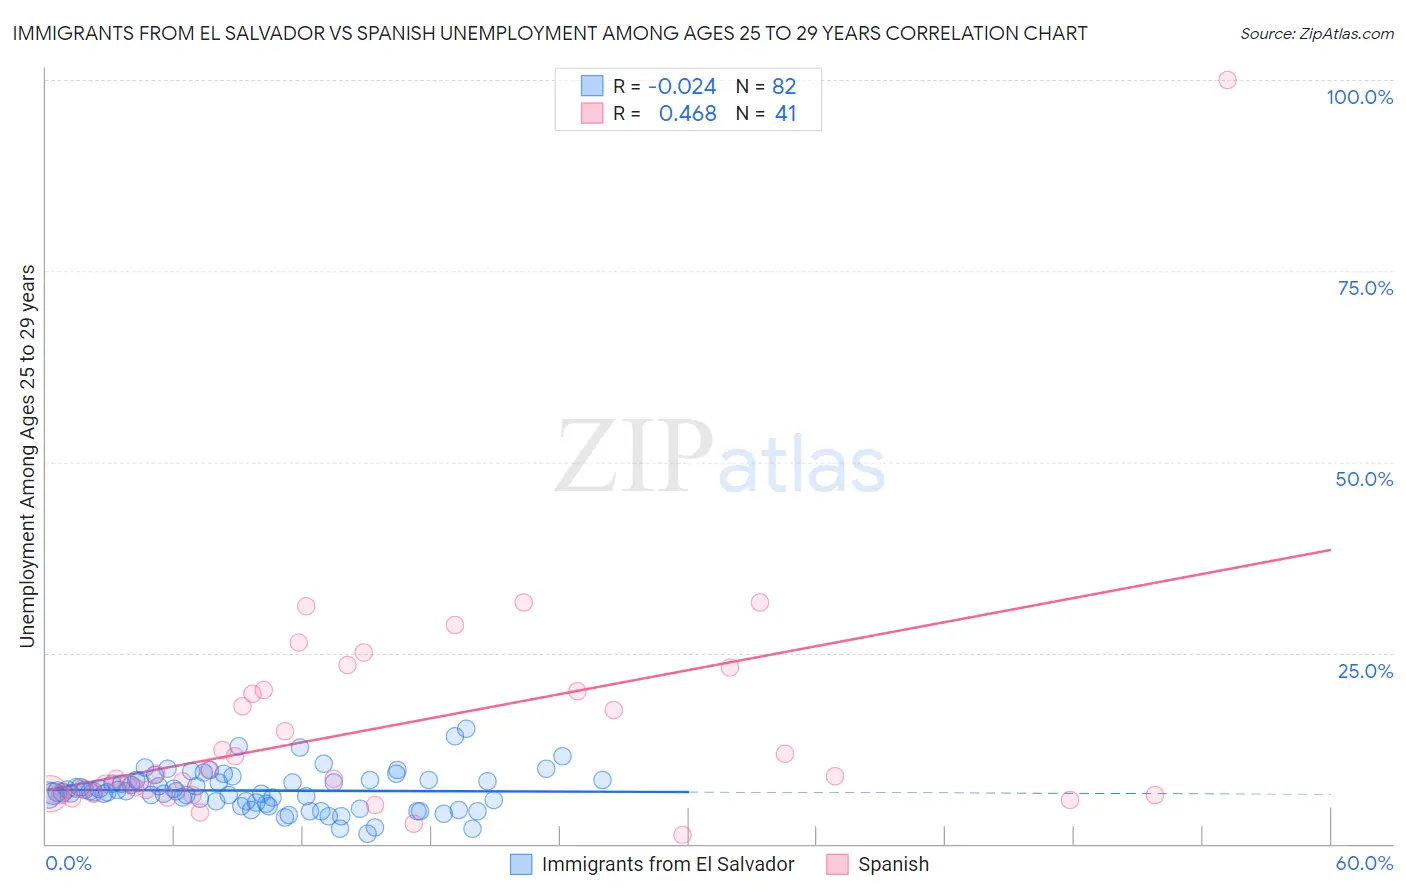
Immigrants from El Salvador vs Spanish Unemployment Among Ages 25 to 29 years Correlation Chart
The statistical analysis conducted on geographies consisting of 345,247,368 people shows no correlation between the proportion of Immigrants from El Salvador and unemployment rate among population between the ages 25 and 29 in the United States with a correlation coefficient (R) of -0.024 and weighted average of 7.0%. Similarly, the statistical analysis conducted on geographies consisting of 399,195,513 people shows a moderate positive correlation between the proportion of Spanish and unemployment rate among population between the ages 25 and 29 in the United States with a correlation coefficient (R) of 0.468 and weighted average of 6.8%, a difference of 2.2%.
Unemployment Among Ages 25 to 29 years Correlation Summary
| Measurement | Immigrants from El Salvador | Spanish |
| Minimum | 1.4% | 1.1% |
| Maximum | 15.1% | 100.0% |
| Range | 13.7% | 98.9% |
| Mean | 7.0% | 15.1% |
| Median | 6.8% | 8.9% |
| Interquartile 25% (IQ1) | 5.5% | 6.5% |
| Interquartile 75% (IQ3) | 8.3% | 20.0% |
| Interquartile Range (IQR) | 2.8% | 13.5% |
| Standard Deviation (Sample) | 2.6% | 16.1% |
| Standard Deviation (Population) | 2.6% | 15.9% |
Demographics Similar to Immigrants from El Salvador and Spanish by Unemployment Among Ages 25 to 29 years
In terms of unemployment among ages 25 to 29 years, the demographic groups most similar to Immigrants from El Salvador are Bermudan (7.0%, a difference of 0.080%), Immigrants from Panama (7.0%, a difference of 0.23%), Salvadoran (7.0%, a difference of 0.29%), Central American (7.0%, a difference of 0.29%), and Immigrants from Liberia (7.0%, a difference of 0.42%). Similarly, the demographic groups most similar to Spanish are Slovak (6.8%, a difference of 0.020%), Liberian (6.8%, a difference of 0.030%), Immigrants from Syria (6.8%, a difference of 0.080%), Ute (6.8%, a difference of 0.13%), and Immigrants from Cabo Verde (6.8%, a difference of 0.20%).
| Demographics | Rating | Rank | Unemployment Among Ages 25 to 29 years |
| Immigrants | Cabo Verde | 16.2 /100 | #212 | Poor 6.8% |
| Immigrants | Syria | 15.1 /100 | #213 | Poor 6.8% |
| Liberians | 14.7 /100 | #214 | Poor 6.8% |
| Spanish | 14.4 /100 | #215 | Poor 6.8% |
| Slovaks | 14.3 /100 | #216 | Poor 6.8% |
| Ute | 13.4 /100 | #217 | Poor 6.8% |
| Immigrants | Austria | 12.3 /100 | #218 | Poor 6.8% |
| Whites/Caucasians | 10.6 /100 | #219 | Poor 6.9% |
| French | 10.5 /100 | #220 | Poor 6.9% |
| Israelis | 9.8 /100 | #221 | Tragic 6.9% |
| Spaniards | 7.7 /100 | #222 | Tragic 6.9% |
| Celtics | 7.6 /100 | #223 | Tragic 6.9% |
| Immigrants | Immigrants | 6.2 /100 | #224 | Tragic 6.9% |
| Japanese | 5.4 /100 | #225 | Tragic 6.9% |
| Immigrants | Liberia | 4.8 /100 | #226 | Tragic 7.0% |
| Salvadorans | 4.4 /100 | #227 | Tragic 7.0% |
| Immigrants | Panama | 4.2 /100 | #228 | Tragic 7.0% |
| Bermudans | 3.8 /100 | #229 | Tragic 7.0% |
| Immigrants | El Salvador | 3.6 /100 | #230 | Tragic 7.0% |
| Central Americans | 3.0 /100 | #231 | Tragic 7.0% |
| Spanish Americans | 2.7 /100 | #232 | Tragic 7.0% |