Immigrants from Egypt vs Soviet Union Unemployment Among Ages 25 to 29 years
COMPARE
Immigrants from Egypt
Soviet Union
Unemployment Among Ages 25 to 29 years
Unemployment Among Ages 25 to 29 years Comparison
Immigrants from Egypt
Soviet Union
6.5%
UNEMPLOYMENT AMONG AGES 25 TO 29 YEARS
87.1/ 100
METRIC RATING
113th/ 347
METRIC RANK
6.2%
UNEMPLOYMENT AMONG AGES 25 TO 29 YEARS
98.9/ 100
METRIC RATING
50th/ 347
METRIC RANK
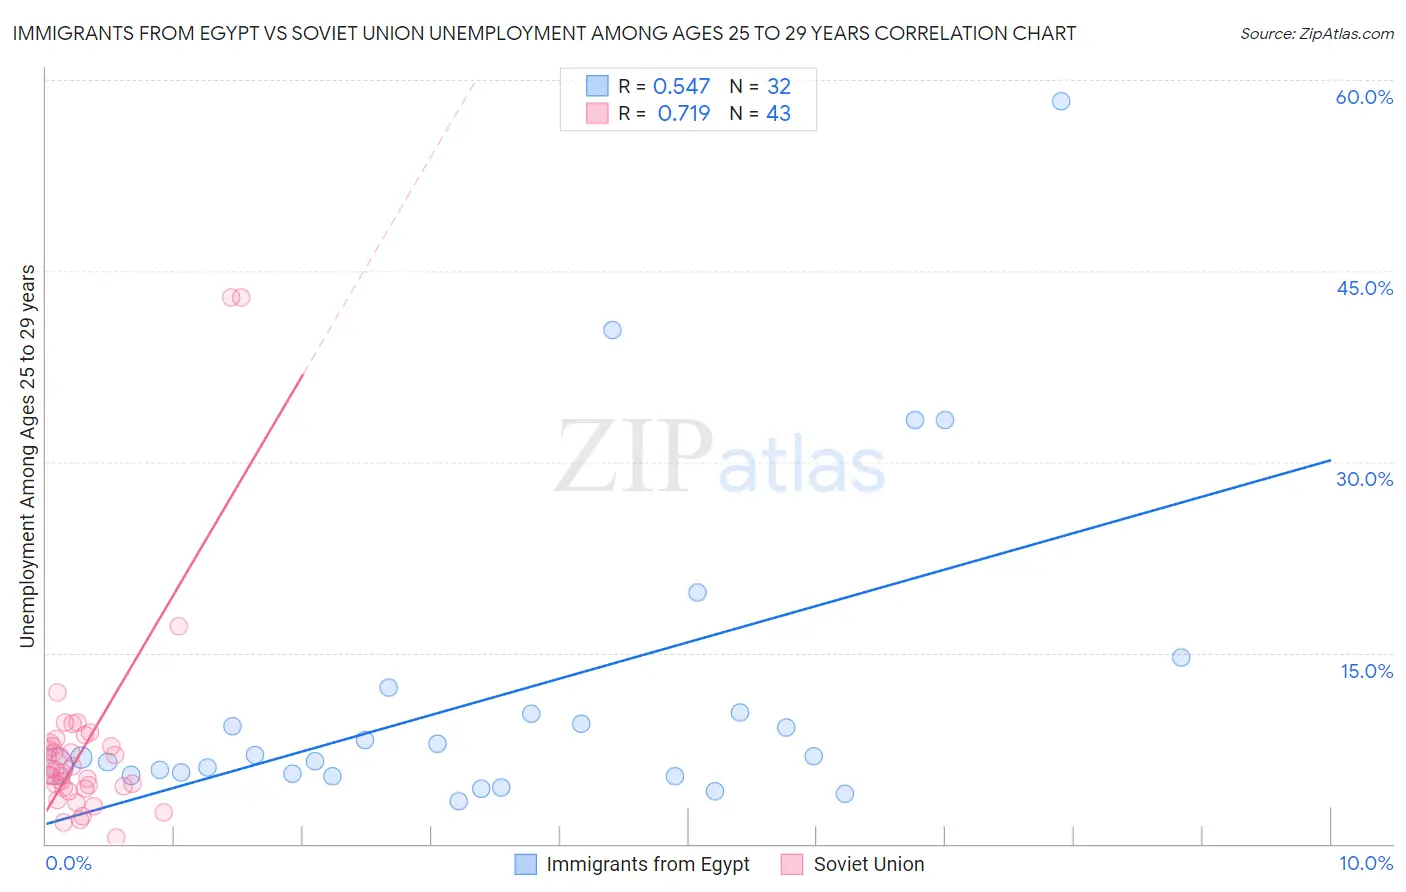
Immigrants from Egypt vs Soviet Union Unemployment Among Ages 25 to 29 years Correlation Chart
The statistical analysis conducted on geographies consisting of 239,151,709 people shows a substantial positive correlation between the proportion of Immigrants from Egypt and unemployment rate among population between the ages 25 and 29 in the United States with a correlation coefficient (R) of 0.547 and weighted average of 6.5%. Similarly, the statistical analysis conducted on geographies consisting of 43,269,095 people shows a strong positive correlation between the proportion of Soviet Union and unemployment rate among population between the ages 25 and 29 in the United States with a correlation coefficient (R) of 0.719 and weighted average of 6.2%, a difference of 4.3%.
Unemployment Among Ages 25 to 29 years Correlation Summary
| Measurement | Immigrants from Egypt | Soviet Union |
| Minimum | 3.3% | 0.50% |
| Maximum | 58.3% | 42.9% |
| Range | 55.0% | 42.4% |
| Mean | 11.7% | 7.7% |
| Median | 6.8% | 5.8% |
| Interquartile 25% (IQ1) | 5.5% | 4.4% |
| Interquartile 75% (IQ3) | 10.2% | 8.0% |
| Interquartile Range (IQR) | 4.8% | 3.6% |
| Standard Deviation (Sample) | 12.4% | 8.4% |
| Standard Deviation (Population) | 12.2% | 8.3% |
Similar Demographics by Unemployment Among Ages 25 to 29 years
Demographics Similar to Immigrants from Egypt by Unemployment Among Ages 25 to 29 years
In terms of unemployment among ages 25 to 29 years, the demographic groups most similar to Immigrants from Egypt are Immigrants from Nicaragua (6.4%, a difference of 0.050%), Immigrants from Colombia (6.4%, a difference of 0.070%), European (6.4%, a difference of 0.11%), German (6.5%, a difference of 0.11%), and Immigrants from Albania (6.4%, a difference of 0.12%).
| Demographics | Rating | Rank | Unemployment Among Ages 25 to 29 years |
| Immigrants | Hungary | 89.4 /100 | #106 | Excellent 6.4% |
| Swiss | 88.6 /100 | #107 | Excellent 6.4% |
| Croatians | 88.2 /100 | #108 | Excellent 6.4% |
| Immigrants | Albania | 87.9 /100 | #109 | Excellent 6.4% |
| Europeans | 87.8 /100 | #110 | Excellent 6.4% |
| Immigrants | Colombia | 87.6 /100 | #111 | Excellent 6.4% |
| Immigrants | Nicaragua | 87.5 /100 | #112 | Excellent 6.4% |
| Immigrants | Egypt | 87.1 /100 | #113 | Excellent 6.5% |
| Germans | 86.3 /100 | #114 | Excellent 6.5% |
| Macedonians | 86.1 /100 | #115 | Excellent 6.5% |
| Pakistanis | 85.9 /100 | #116 | Excellent 6.5% |
| Immigrants | Uruguay | 85.7 /100 | #117 | Excellent 6.5% |
| Chileans | 85.3 /100 | #118 | Excellent 6.5% |
| Immigrants | South Africa | 84.9 /100 | #119 | Excellent 6.5% |
| Immigrants | Moldova | 84.5 /100 | #120 | Excellent 6.5% |
Demographics Similar to Soviet Union by Unemployment Among Ages 25 to 29 years
In terms of unemployment among ages 25 to 29 years, the demographic groups most similar to Soviet Union are Burmese (6.2%, a difference of 0.030%), German Russian (6.2%, a difference of 0.060%), Immigrants from Turkey (6.2%, a difference of 0.080%), Immigrants from Australia (6.2%, a difference of 0.12%), and Latvian (6.2%, a difference of 0.14%).
| Demographics | Rating | Rank | Unemployment Among Ages 25 to 29 years |
| Czechs | 99.2 /100 | #43 | Exceptional 6.2% |
| Mongolians | 99.2 /100 | #44 | Exceptional 6.2% |
| Venezuelans | 99.1 /100 | #45 | Exceptional 6.2% |
| Immigrants | Lithuania | 99.0 /100 | #46 | Exceptional 6.2% |
| Latvians | 99.0 /100 | #47 | Exceptional 6.2% |
| Immigrants | Australia | 99.0 /100 | #48 | Exceptional 6.2% |
| German Russians | 99.0 /100 | #49 | Exceptional 6.2% |
| Soviet Union | 98.9 /100 | #50 | Exceptional 6.2% |
| Burmese | 98.9 /100 | #51 | Exceptional 6.2% |
| Immigrants | Turkey | 98.9 /100 | #52 | Exceptional 6.2% |
| Turks | 98.8 /100 | #53 | Exceptional 6.2% |
| Swedes | 98.8 /100 | #54 | Exceptional 6.2% |
| Immigrants | Netherlands | 98.7 /100 | #55 | Exceptional 6.2% |
| Immigrants | Burma/Myanmar | 98.7 /100 | #56 | Exceptional 6.2% |
| Immigrants | Saudi Arabia | 98.6 /100 | #57 | Exceptional 6.2% |