Immigrants from Egypt vs Somali Unemployment Among Seniors over 65 years
COMPARE
Immigrants from Egypt
Somali
Unemployment Among Seniors over 65 years
Unemployment Among Seniors over 65 years Comparison
Immigrants from Egypt
Somalis
5.2%
UNEMPLOYMENT AMONG SENIORS OVER 65 YEARS
33.2/ 100
METRIC RATING
188th/ 347
METRIC RANK
5.2%
UNEMPLOYMENT AMONG SENIORS OVER 65 YEARS
33.5/ 100
METRIC RATING
187th/ 347
METRIC RANK
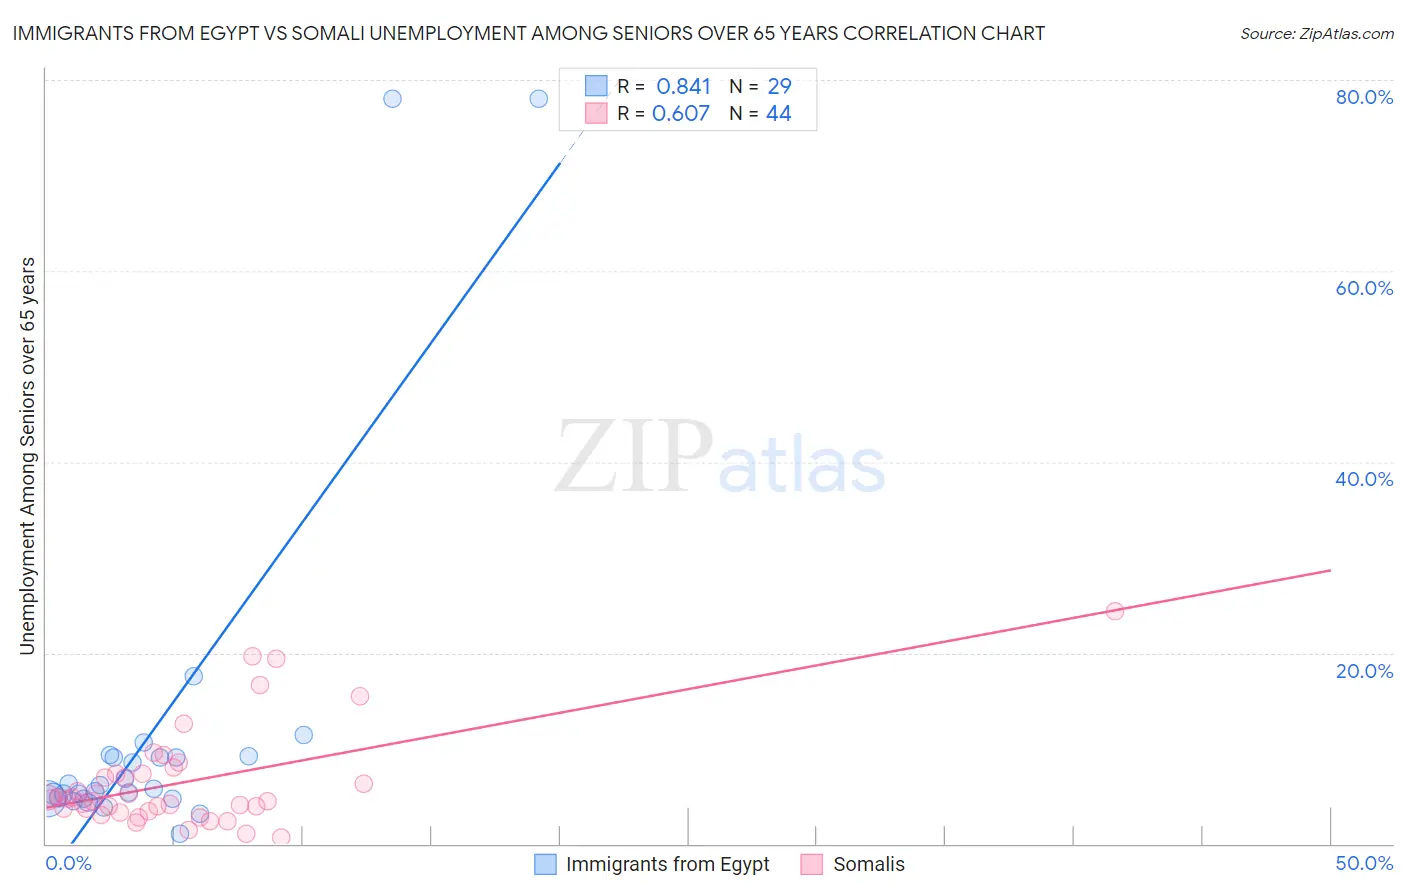
Immigrants from Egypt vs Somali Unemployment Among Seniors over 65 years Correlation Chart
The statistical analysis conducted on geographies consisting of 233,399,590 people shows a very strong positive correlation between the proportion of Immigrants from Egypt and unemployment rate amomg seniors over the age of 65 in the United States with a correlation coefficient (R) of 0.841 and weighted average of 5.2%. Similarly, the statistical analysis conducted on geographies consisting of 94,958,941 people shows a significant positive correlation between the proportion of Somalis and unemployment rate amomg seniors over the age of 65 in the United States with a correlation coefficient (R) of 0.607 and weighted average of 5.2%, a difference of 0.010%.
Unemployment Among Seniors over 65 years Correlation Summary
| Measurement | Immigrants from Egypt | Somali |
| Minimum | 1.1% | 0.70% |
| Maximum | 78.0% | 24.3% |
| Range | 76.9% | 23.6% |
| Mean | 11.6% | 6.4% |
| Median | 5.7% | 4.8% |
| Interquartile 25% (IQ1) | 4.7% | 3.5% |
| Interquartile 75% (IQ3) | 9.1% | 7.3% |
| Interquartile Range (IQR) | 4.4% | 3.8% |
| Standard Deviation (Sample) | 18.7% | 5.2% |
| Standard Deviation (Population) | 18.3% | 5.2% |
Demographics Similar to Immigrants from Egypt and Somalis by Unemployment Among Seniors over 65 years
In terms of unemployment among seniors over 65 years, the demographic groups most similar to Immigrants from Egypt are Bangladeshi (5.2%, a difference of 0.040%), Korean (5.2%, a difference of 0.060%), American (5.2%, a difference of 0.070%), Immigrants from Denmark (5.2%, a difference of 0.080%), and Sioux (5.2%, a difference of 0.090%). Similarly, the demographic groups most similar to Somalis are Bangladeshi (5.2%, a difference of 0.050%), American (5.2%, a difference of 0.060%), Korean (5.2%, a difference of 0.070%), Immigrants from Iran (5.2%, a difference of 0.090%), and Immigrants from Denmark (5.2%, a difference of 0.090%).
| Demographics | Rating | Rank | Unemployment Among Seniors over 65 years |
| Icelanders | 45.9 /100 | #177 | Average 5.2% |
| Immigrants | Belgium | 44.8 /100 | #178 | Average 5.2% |
| Immigrants | Somalia | 44.0 /100 | #179 | Average 5.2% |
| Russians | 43.6 /100 | #180 | Average 5.2% |
| Immigrants | Italy | 43.5 /100 | #181 | Average 5.2% |
| Panamanians | 43.0 /100 | #182 | Average 5.2% |
| Immigrants | Western Asia | 42.1 /100 | #183 | Average 5.2% |
| Immigrants | Serbia | 41.6 /100 | #184 | Average 5.2% |
| Immigrants | Iran | 36.0 /100 | #185 | Fair 5.2% |
| Americans | 35.1 /100 | #186 | Fair 5.2% |
| Somalis | 33.5 /100 | #187 | Fair 5.2% |
| Immigrants | Egypt | 33.2 /100 | #188 | Fair 5.2% |
| Bangladeshis | 32.3 /100 | #189 | Fair 5.2% |
| Koreans | 31.6 /100 | #190 | Fair 5.2% |
| Immigrants | Denmark | 31.0 /100 | #191 | Fair 5.2% |
| Sioux | 30.8 /100 | #192 | Fair 5.2% |
| Immigrants | Africa | 29.6 /100 | #193 | Fair 5.2% |
| Argentineans | 29.1 /100 | #194 | Fair 5.2% |
| Costa Ricans | 27.0 /100 | #195 | Fair 5.2% |
| Immigrants | Poland | 24.3 /100 | #196 | Fair 5.2% |
| Guamanians/Chamorros | 22.5 /100 | #197 | Fair 5.2% |