Immigrants from Ecuador vs Immigrants from West Indies Unemployment Among Youth under 25 years
COMPARE
Immigrants from Ecuador
Immigrants from West Indies
Unemployment Among Youth under 25 years
Unemployment Among Youth under 25 years Comparison
Immigrants from Ecuador
Immigrants from West Indies
13.4%
UNEMPLOYMENT AMONG YOUTH UNDER 25 YEARS
0.0/ 100
METRIC RATING
290th/ 347
METRIC RANK
14.2%
UNEMPLOYMENT AMONG YOUTH UNDER 25 YEARS
0.0/ 100
METRIC RATING
310th/ 347
METRIC RANK
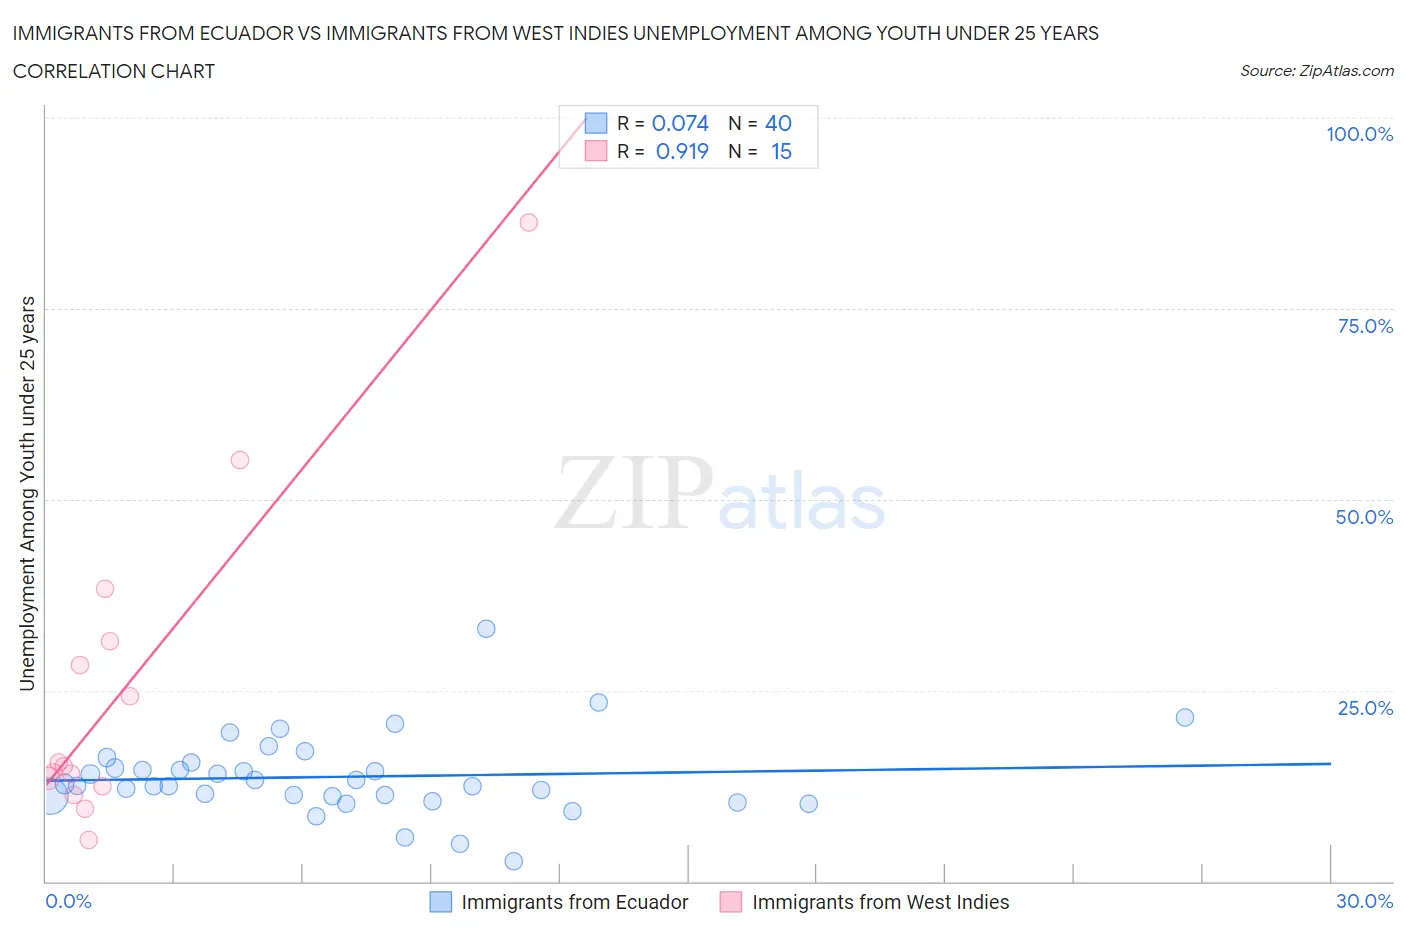
Immigrants from Ecuador vs Immigrants from West Indies Unemployment Among Youth under 25 years Correlation Chart
The statistical analysis conducted on geographies consisting of 269,322,147 people shows a slight positive correlation between the proportion of Immigrants from Ecuador and unemployment rate among youth under the age of 25 in the United States with a correlation coefficient (R) of 0.074 and weighted average of 13.4%. Similarly, the statistical analysis conducted on geographies consisting of 72,363,085 people shows a near-perfect positive correlation between the proportion of Immigrants from West Indies and unemployment rate among youth under the age of 25 in the United States with a correlation coefficient (R) of 0.919 and weighted average of 14.2%, a difference of 5.8%.
Unemployment Among Youth under 25 years Correlation Summary
| Measurement | Immigrants from Ecuador | Immigrants from West Indies |
| Minimum | 2.6% | 5.4% |
| Maximum | 33.1% | 86.2% |
| Range | 30.5% | 80.8% |
| Mean | 13.7% | 25.0% |
| Median | 12.6% | 15.0% |
| Interquartile 25% (IQ1) | 11.1% | 12.4% |
| Interquartile 75% (IQ3) | 15.2% | 31.5% |
| Interquartile Range (IQR) | 4.0% | 19.1% |
| Standard Deviation (Sample) | 5.3% | 21.4% |
| Standard Deviation (Population) | 5.2% | 20.7% |
Demographics Similar to Immigrants from Ecuador and Immigrants from West Indies by Unemployment Among Youth under 25 years
In terms of unemployment among youth under 25 years, the demographic groups most similar to Immigrants from Ecuador are Apache (13.5%, a difference of 0.25%), Central American Indian (13.5%, a difference of 0.28%), Spanish American Indian (13.5%, a difference of 0.40%), Immigrants from Caribbean (13.5%, a difference of 0.56%), and Chippewa (13.5%, a difference of 0.80%). Similarly, the demographic groups most similar to Immigrants from West Indies are Aleut (14.1%, a difference of 0.54%), Immigrants from Belize (14.0%, a difference of 1.4%), Immigrants from Haiti (14.0%, a difference of 1.8%), Pueblo (13.9%, a difference of 2.3%), and Haitian (13.9%, a difference of 2.4%).
| Demographics | Rating | Rank | Unemployment Among Youth under 25 years |
| Immigrants | Ecuador | 0.0 /100 | #290 | Tragic 13.4% |
| Apache | 0.0 /100 | #291 | Tragic 13.5% |
| Central American Indians | 0.0 /100 | #292 | Tragic 13.5% |
| Spanish American Indians | 0.0 /100 | #293 | Tragic 13.5% |
| Immigrants | Caribbean | 0.0 /100 | #294 | Tragic 13.5% |
| Chippewa | 0.0 /100 | #295 | Tragic 13.5% |
| Senegalese | 0.0 /100 | #296 | Tragic 13.5% |
| U.S. Virgin Islanders | 0.0 /100 | #297 | Tragic 13.6% |
| Shoshone | 0.0 /100 | #298 | Tragic 13.7% |
| Tohono O'odham | 0.0 /100 | #299 | Tragic 13.8% |
| Immigrants | Cabo Verde | 0.0 /100 | #300 | Tragic 13.8% |
| Immigrants | Senegal | 0.0 /100 | #301 | Tragic 13.8% |
| Immigrants | Sierra Leone | 0.0 /100 | #302 | Tragic 13.8% |
| Belizeans | 0.0 /100 | #303 | Tragic 13.8% |
| Houma | 0.0 /100 | #304 | Tragic 13.8% |
| Haitians | 0.0 /100 | #305 | Tragic 13.9% |
| Pueblo | 0.0 /100 | #306 | Tragic 13.9% |
| Immigrants | Haiti | 0.0 /100 | #307 | Tragic 14.0% |
| Immigrants | Belize | 0.0 /100 | #308 | Tragic 14.0% |
| Aleuts | 0.0 /100 | #309 | Tragic 14.1% |
| Immigrants | West Indies | 0.0 /100 | #310 | Tragic 14.2% |