Immigrants from Ecuador vs Cuban Unemployment Among Ages 65 to 74 years
COMPARE
Immigrants from Ecuador
Cuban
Unemployment Among Ages 65 to 74 years
Unemployment Among Ages 65 to 74 years Comparison
Immigrants from Ecuador
Cubans
5.8%
UNEMPLOYMENT AMONG AGES 65 TO 74 YEARS
0.0/ 100
METRIC RATING
309th/ 347
METRIC RANK
4.8%
UNEMPLOYMENT AMONG AGES 65 TO 74 YEARS
100.0/ 100
METRIC RATING
14th/ 347
METRIC RANK
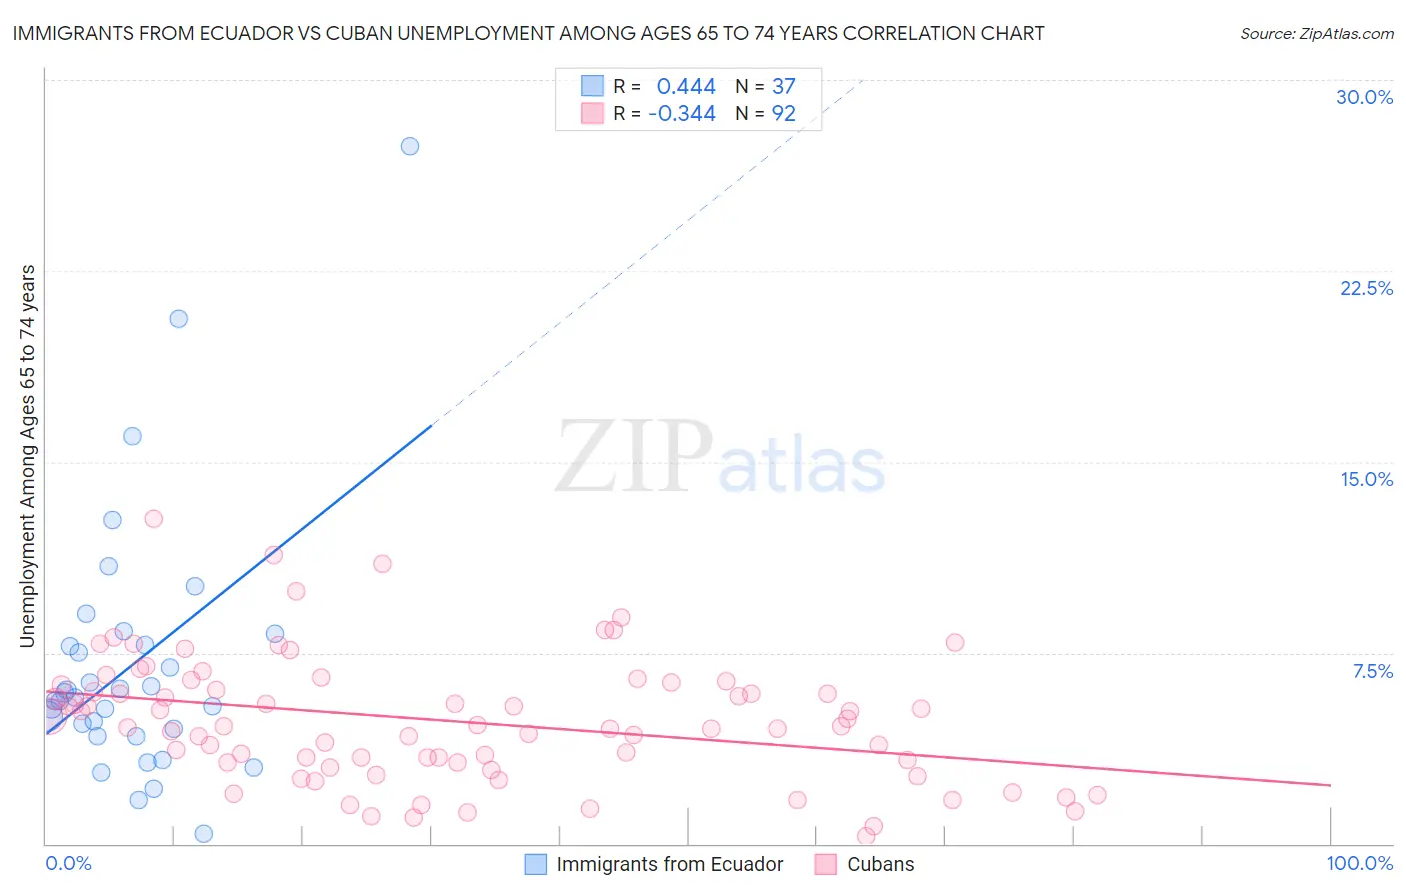
Immigrants from Ecuador vs Cuban Unemployment Among Ages 65 to 74 years Correlation Chart
The statistical analysis conducted on geographies consisting of 250,466,879 people shows a moderate positive correlation between the proportion of Immigrants from Ecuador and unemployment rate among population between the ages 65 and 74 in the United States with a correlation coefficient (R) of 0.444 and weighted average of 5.8%. Similarly, the statistical analysis conducted on geographies consisting of 388,133,736 people shows a mild negative correlation between the proportion of Cubans and unemployment rate among population between the ages 65 and 74 in the United States with a correlation coefficient (R) of -0.344 and weighted average of 4.8%, a difference of 22.6%.
Unemployment Among Ages 65 to 74 years Correlation Summary
| Measurement | Immigrants from Ecuador | Cuban |
| Minimum | 0.40% | 0.30% |
| Maximum | 27.4% | 12.8% |
| Range | 27.0% | 12.5% |
| Mean | 7.1% | 4.8% |
| Median | 5.7% | 4.6% |
| Interquartile 25% (IQ1) | 4.4% | 3.2% |
| Interquartile 75% (IQ3) | 8.0% | 6.3% |
| Interquartile Range (IQR) | 3.7% | 3.1% |
| Standard Deviation (Sample) | 5.2% | 2.5% |
| Standard Deviation (Population) | 5.1% | 2.5% |
Similar Demographics by Unemployment Among Ages 65 to 74 years
Demographics Similar to Immigrants from Ecuador by Unemployment Among Ages 65 to 74 years
In terms of unemployment among ages 65 to 74 years, the demographic groups most similar to Immigrants from Ecuador are Guatemalan (5.8%, a difference of 0.040%), Mexican (5.8%, a difference of 0.13%), Cheyenne (5.8%, a difference of 0.13%), British West Indian (5.8%, a difference of 0.13%), and Immigrants from Bangladesh (5.9%, a difference of 0.14%).
| Demographics | Rating | Rank | Unemployment Among Ages 65 to 74 years |
| Liberians | 0.0 /100 | #302 | Tragic 5.8% |
| Arapaho | 0.0 /100 | #303 | Tragic 5.8% |
| Salvadorans | 0.0 /100 | #304 | Tragic 5.8% |
| Mexicans | 0.0 /100 | #305 | Tragic 5.8% |
| Cheyenne | 0.0 /100 | #306 | Tragic 5.8% |
| British West Indians | 0.0 /100 | #307 | Tragic 5.8% |
| Guatemalans | 0.0 /100 | #308 | Tragic 5.8% |
| Immigrants | Ecuador | 0.0 /100 | #309 | Tragic 5.8% |
| Immigrants | Bangladesh | 0.0 /100 | #310 | Tragic 5.9% |
| Venezuelans | 0.0 /100 | #311 | Tragic 5.9% |
| Hispanics or Latinos | 0.0 /100 | #312 | Tragic 5.9% |
| Vietnamese | 0.0 /100 | #313 | Tragic 5.9% |
| Immigrants | Venezuela | 0.0 /100 | #314 | Tragic 5.9% |
| Immigrants | Guatemala | 0.0 /100 | #315 | Tragic 5.9% |
| Immigrants | El Salvador | 0.0 /100 | #316 | Tragic 5.9% |
Demographics Similar to Cubans by Unemployment Among Ages 65 to 74 years
In terms of unemployment among ages 65 to 74 years, the demographic groups most similar to Cubans are Lumbee (4.8%, a difference of 0.28%), Tongan (4.7%, a difference of 0.47%), Immigrants from Congo (4.7%, a difference of 0.63%), Immigrants from North Macedonia (4.8%, a difference of 0.83%), and Osage (4.7%, a difference of 1.0%).
| Demographics | Rating | Rank | Unemployment Among Ages 65 to 74 years |
| Indonesians | 100.0 /100 | #7 | Exceptional 4.7% |
| Comanche | 100.0 /100 | #8 | Exceptional 4.7% |
| Chickasaw | 100.0 /100 | #9 | Exceptional 4.7% |
| Osage | 100.0 /100 | #10 | Exceptional 4.7% |
| Immigrants | Congo | 100.0 /100 | #11 | Exceptional 4.7% |
| Tongans | 100.0 /100 | #12 | Exceptional 4.7% |
| Lumbee | 100.0 /100 | #13 | Exceptional 4.8% |
| Cubans | 100.0 /100 | #14 | Exceptional 4.8% |
| Immigrants | North Macedonia | 100.0 /100 | #15 | Exceptional 4.8% |
| Immigrants | Burma/Myanmar | 100.0 /100 | #16 | Exceptional 4.8% |
| Kenyans | 100.0 /100 | #17 | Exceptional 4.8% |
| Creek | 100.0 /100 | #18 | Exceptional 4.8% |
| Menominee | 100.0 /100 | #19 | Exceptional 4.8% |
| Immigrants | Zaire | 100.0 /100 | #20 | Exceptional 4.8% |
| Immigrants | Eritrea | 100.0 /100 | #21 | Exceptional 4.9% |