Immigrants from Eastern Europe vs Celtic Unemployment Among Ages 45 to 54 years
COMPARE
Immigrants from Eastern Europe
Celtic
Unemployment Among Ages 45 to 54 years
Unemployment Among Ages 45 to 54 years Comparison
Immigrants from Eastern Europe
Celtics
4.5%
UNEMPLOYMENT AMONG AGES 45 TO 54 YEARS
61.6/ 100
METRIC RATING
161st/ 347
METRIC RANK
4.4%
UNEMPLOYMENT AMONG AGES 45 TO 54 YEARS
86.2/ 100
METRIC RATING
130th/ 347
METRIC RANK
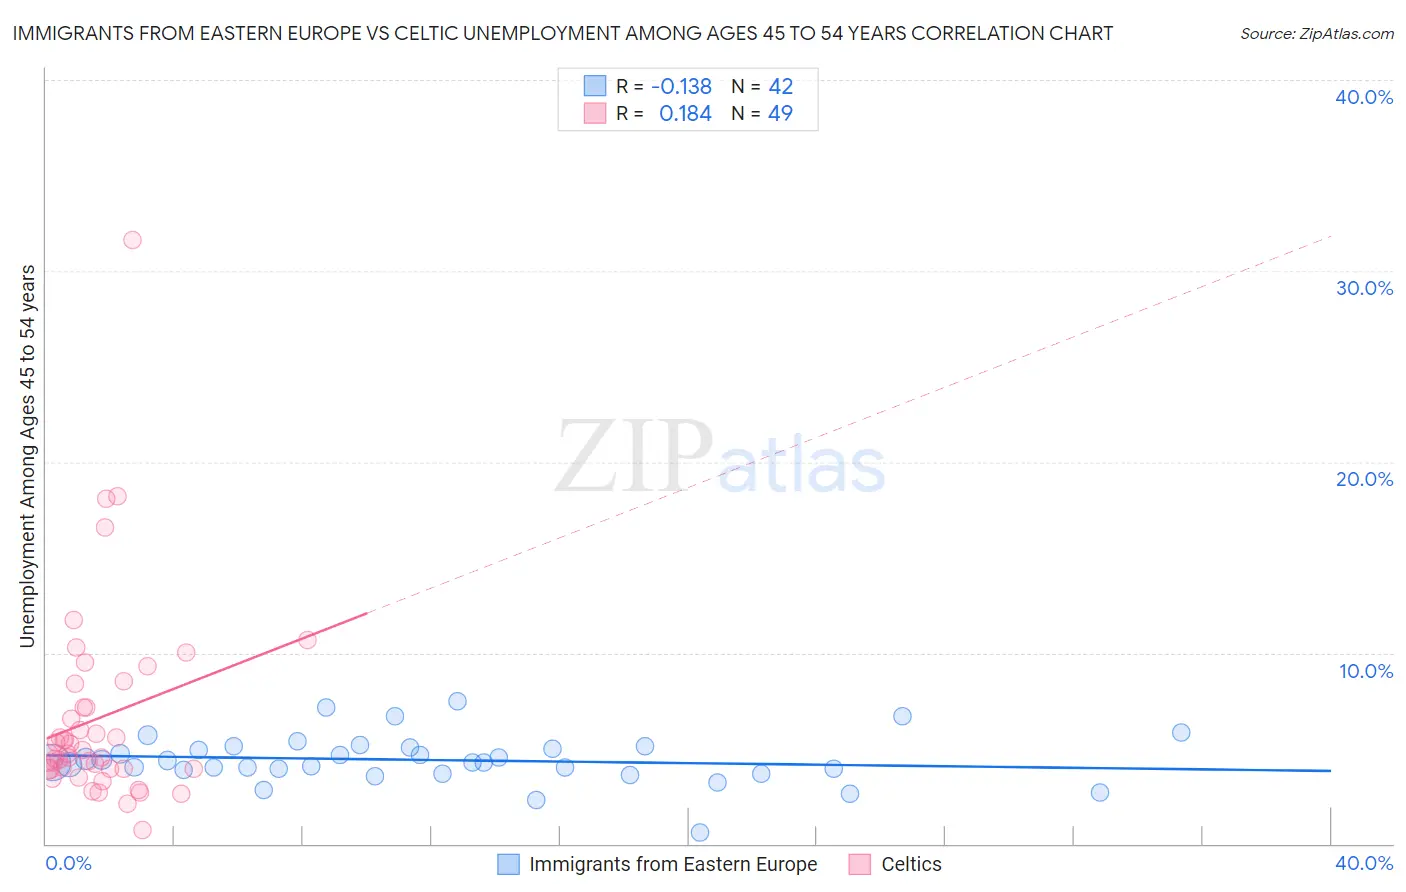
Immigrants from Eastern Europe vs Celtic Unemployment Among Ages 45 to 54 years Correlation Chart
The statistical analysis conducted on geographies consisting of 457,626,401 people shows a poor negative correlation between the proportion of Immigrants from Eastern Europe and unemployment rate among population between the ages 45 and 54 in the United States with a correlation coefficient (R) of -0.138 and weighted average of 4.5%. Similarly, the statistical analysis conducted on geographies consisting of 166,346,442 people shows a poor positive correlation between the proportion of Celtics and unemployment rate among population between the ages 45 and 54 in the United States with a correlation coefficient (R) of 0.184 and weighted average of 4.4%, a difference of 1.6%.
Unemployment Among Ages 45 to 54 years Correlation Summary
| Measurement | Immigrants from Eastern Europe | Celtic |
| Minimum | 0.60% | 0.70% |
| Maximum | 7.4% | 31.6% |
| Range | 6.8% | 30.9% |
| Mean | 4.4% | 6.6% |
| Median | 4.3% | 4.7% |
| Interquartile 25% (IQ1) | 3.8% | 3.9% |
| Interquartile 75% (IQ3) | 5.0% | 7.8% |
| Interquartile Range (IQR) | 1.2% | 3.9% |
| Standard Deviation (Sample) | 1.3% | 5.3% |
| Standard Deviation (Population) | 1.3% | 5.2% |
Similar Demographics by Unemployment Among Ages 45 to 54 years
Demographics Similar to Immigrants from Eastern Europe by Unemployment Among Ages 45 to 54 years
In terms of unemployment among ages 45 to 54 years, the demographic groups most similar to Immigrants from Eastern Europe are Immigrants from South Eastern Asia (4.5%, a difference of 0.020%), Nonimmigrants (4.5%, a difference of 0.060%), Immigrants from Indonesia (4.5%, a difference of 0.060%), Bangladeshi (4.5%, a difference of 0.090%), and Samoan (4.5%, a difference of 0.15%).
| Demographics | Rating | Rank | Unemployment Among Ages 45 to 54 years |
| Immigrants | Spain | 72.5 /100 | #154 | Good 4.5% |
| Marshallese | 70.6 /100 | #155 | Good 4.5% |
| Immigrants | Croatia | 69.6 /100 | #156 | Good 4.5% |
| Indians (Asian) | 68.1 /100 | #157 | Good 4.5% |
| Immigrants | Italy | 65.5 /100 | #158 | Good 4.5% |
| Immigrants | Nonimmigrants | 62.8 /100 | #159 | Good 4.5% |
| Immigrants | South Eastern Asia | 62.0 /100 | #160 | Good 4.5% |
| Immigrants | Eastern Europe | 61.6 /100 | #161 | Good 4.5% |
| Immigrants | Indonesia | 60.3 /100 | #162 | Good 4.5% |
| Bangladeshis | 59.7 /100 | #163 | Average 4.5% |
| Samoans | 58.5 /100 | #164 | Average 4.5% |
| Maltese | 57.9 /100 | #165 | Average 4.5% |
| Immigrants | Western Europe | 57.4 /100 | #166 | Average 4.5% |
| Immigrants | Brazil | 56.4 /100 | #167 | Average 4.5% |
| Immigrants | Europe | 54.7 /100 | #168 | Average 4.5% |
Demographics Similar to Celtics by Unemployment Among Ages 45 to 54 years
In terms of unemployment among ages 45 to 54 years, the demographic groups most similar to Celtics are Laotian (4.4%, a difference of 0.020%), Immigrants from Germany (4.4%, a difference of 0.030%), Immigrants from Northern Europe (4.4%, a difference of 0.080%), Immigrants from Eastern Africa (4.4%, a difference of 0.11%), and Immigrants from Cameroon (4.4%, a difference of 0.13%).
| Demographics | Rating | Rank | Unemployment Among Ages 45 to 54 years |
| Immigrants | Asia | 88.8 /100 | #123 | Excellent 4.4% |
| Spanish | 88.8 /100 | #124 | Excellent 4.4% |
| Immigrants | Vietnam | 88.6 /100 | #125 | Excellent 4.4% |
| Immigrants | Czechoslovakia | 87.8 /100 | #126 | Excellent 4.4% |
| Nicaraguans | 87.6 /100 | #127 | Excellent 4.4% |
| Immigrants | Northern Europe | 86.9 /100 | #128 | Excellent 4.4% |
| Laotians | 86.3 /100 | #129 | Excellent 4.4% |
| Celtics | 86.2 /100 | #130 | Excellent 4.4% |
| Immigrants | Germany | 85.9 /100 | #131 | Excellent 4.4% |
| Immigrants | Eastern Africa | 85.1 /100 | #132 | Excellent 4.4% |
| Immigrants | Cameroon | 84.8 /100 | #133 | Excellent 4.4% |
| Afghans | 84.6 /100 | #134 | Excellent 4.4% |
| Immigrants | Eastern Asia | 84.0 /100 | #135 | Excellent 4.4% |
| Immigrants | Middle Africa | 83.3 /100 | #136 | Excellent 4.4% |
| Lebanese | 81.9 /100 | #137 | Excellent 4.4% |