Immigrants from Eastern Asia vs Creek Unemployment Among Seniors over 75 years
COMPARE
Immigrants from Eastern Asia
Creek
Unemployment Among Seniors over 75 years
Unemployment Among Seniors over 75 years Comparison
Immigrants from Eastern Asia
Creek
7.9%
UNEMPLOYMENT AMONG SENIORS OVER 75 YEARS
99.9/ 100
METRIC RATING
56th/ 347
METRIC RANK
7.8%
UNEMPLOYMENT AMONG SENIORS OVER 75 YEARS
100.0/ 100
METRIC RATING
47th/ 347
METRIC RANK
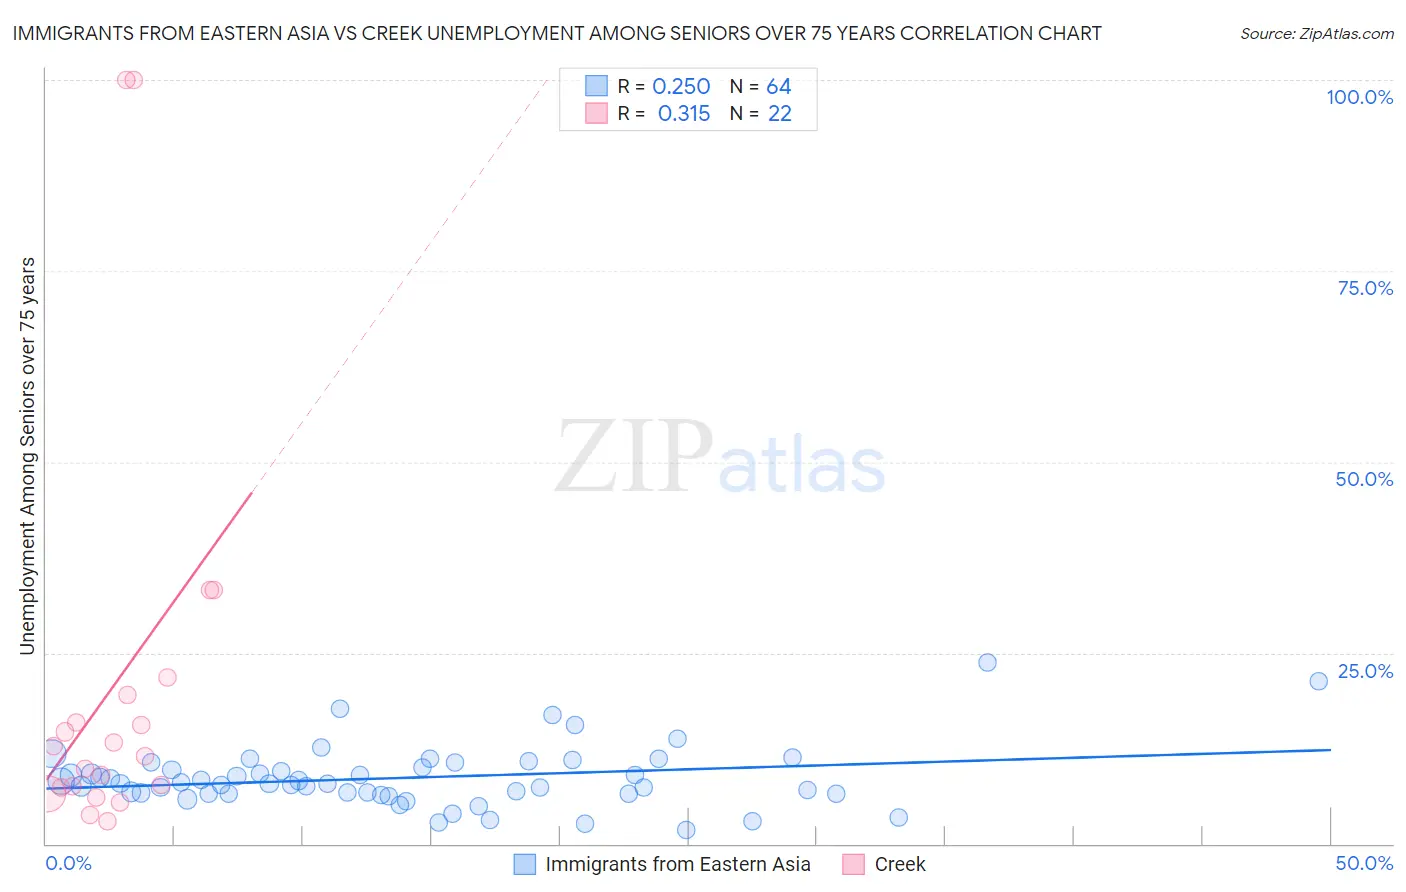
Immigrants from Eastern Asia vs Creek Unemployment Among Seniors over 75 years Correlation Chart
The statistical analysis conducted on geographies consisting of 226,570,073 people shows a weak positive correlation between the proportion of Immigrants from Eastern Asia and unemployment rate among seniors over the age of 75 in the United States with a correlation coefficient (R) of 0.250 and weighted average of 7.9%. Similarly, the statistical analysis conducted on geographies consisting of 116,261,901 people shows a mild positive correlation between the proportion of Creek and unemployment rate among seniors over the age of 75 in the United States with a correlation coefficient (R) of 0.315 and weighted average of 7.8%, a difference of 1.0%.
Unemployment Among Seniors over 75 years Correlation Summary
| Measurement | Immigrants from Eastern Asia | Creek |
| Minimum | 1.8% | 3.0% |
| Maximum | 23.8% | 100.0% |
| Range | 22.0% | 97.0% |
| Mean | 8.6% | 20.8% |
| Median | 7.9% | 12.2% |
| Interquartile 25% (IQ1) | 6.5% | 7.4% |
| Interquartile 75% (IQ3) | 10.3% | 19.4% |
| Interquartile Range (IQR) | 3.7% | 12.0% |
| Standard Deviation (Sample) | 4.0% | 26.9% |
| Standard Deviation (Population) | 4.0% | 26.3% |
Demographics Similar to Immigrants from Eastern Asia and Creek by Unemployment Among Seniors over 75 years
In terms of unemployment among seniors over 75 years, the demographic groups most similar to Immigrants from Eastern Asia are Filipino (7.9%, a difference of 0.010%), Ottawa (7.9%, a difference of 0.17%), Iranian (7.9%, a difference of 0.22%), Immigrants from Malaysia (7.9%, a difference of 0.33%), and Immigrants from Egypt (7.9%, a difference of 0.37%). Similarly, the demographic groups most similar to Creek are Immigrants from Chile (7.8%, a difference of 0.22%), Potawatomi (7.8%, a difference of 0.26%), Immigrants from Latvia (7.8%, a difference of 0.28%), Moroccan (7.8%, a difference of 0.33%), and Immigrants from China (7.8%, a difference of 0.41%).
| Demographics | Rating | Rank | Unemployment Among Seniors over 75 years |
| Immigrants | Burma/Myanmar | 100.0 /100 | #41 | Exceptional 7.7% |
| Pueblo | 100.0 /100 | #42 | Exceptional 7.7% |
| Immigrants | Denmark | 100.0 /100 | #43 | Exceptional 7.8% |
| Immigrants | Spain | 100.0 /100 | #44 | Exceptional 7.8% |
| British West Indians | 100.0 /100 | #45 | Exceptional 7.8% |
| Immigrants | China | 100.0 /100 | #46 | Exceptional 7.8% |
| Creek | 100.0 /100 | #47 | Exceptional 7.8% |
| Immigrants | Chile | 100.0 /100 | #48 | Exceptional 7.8% |
| Potawatomi | 100.0 /100 | #49 | Exceptional 7.8% |
| Immigrants | Latvia | 100.0 /100 | #50 | Exceptional 7.8% |
| Moroccans | 100.0 /100 | #51 | Exceptional 7.8% |
| Bahamians | 100.0 /100 | #52 | Exceptional 7.8% |
| Immigrants | Egypt | 100.0 /100 | #53 | Exceptional 7.9% |
| Immigrants | Malaysia | 99.9 /100 | #54 | Exceptional 7.9% |
| Filipinos | 99.9 /100 | #55 | Exceptional 7.9% |
| Immigrants | Eastern Asia | 99.9 /100 | #56 | Exceptional 7.9% |
| Ottawa | 99.9 /100 | #57 | Exceptional 7.9% |
| Iranians | 99.9 /100 | #58 | Exceptional 7.9% |
| Indonesians | 99.9 /100 | #59 | Exceptional 7.9% |
| Immigrants | Morocco | 99.9 /100 | #60 | Exceptional 7.9% |
| Uruguayans | 99.9 /100 | #61 | Exceptional 7.9% |