Immigrants from Eastern Africa vs Paiute Unemployment Among Women with Children Under 18 years
COMPARE
Immigrants from Eastern Africa
Paiute
Unemployment Among Women with Children Under 18 years
Unemployment Among Women with Children Under 18 years Comparison
Immigrants from Eastern Africa
Paiute
5.4%
UNEMPLOYMENT AMONG WOMEN WITH CHILDREN UNDER 18 YEARS
51.3/ 100
METRIC RATING
173rd/ 347
METRIC RANK
6.9%
UNEMPLOYMENT AMONG WOMEN WITH CHILDREN UNDER 18 YEARS
0.0/ 100
METRIC RATING
324th/ 347
METRIC RANK
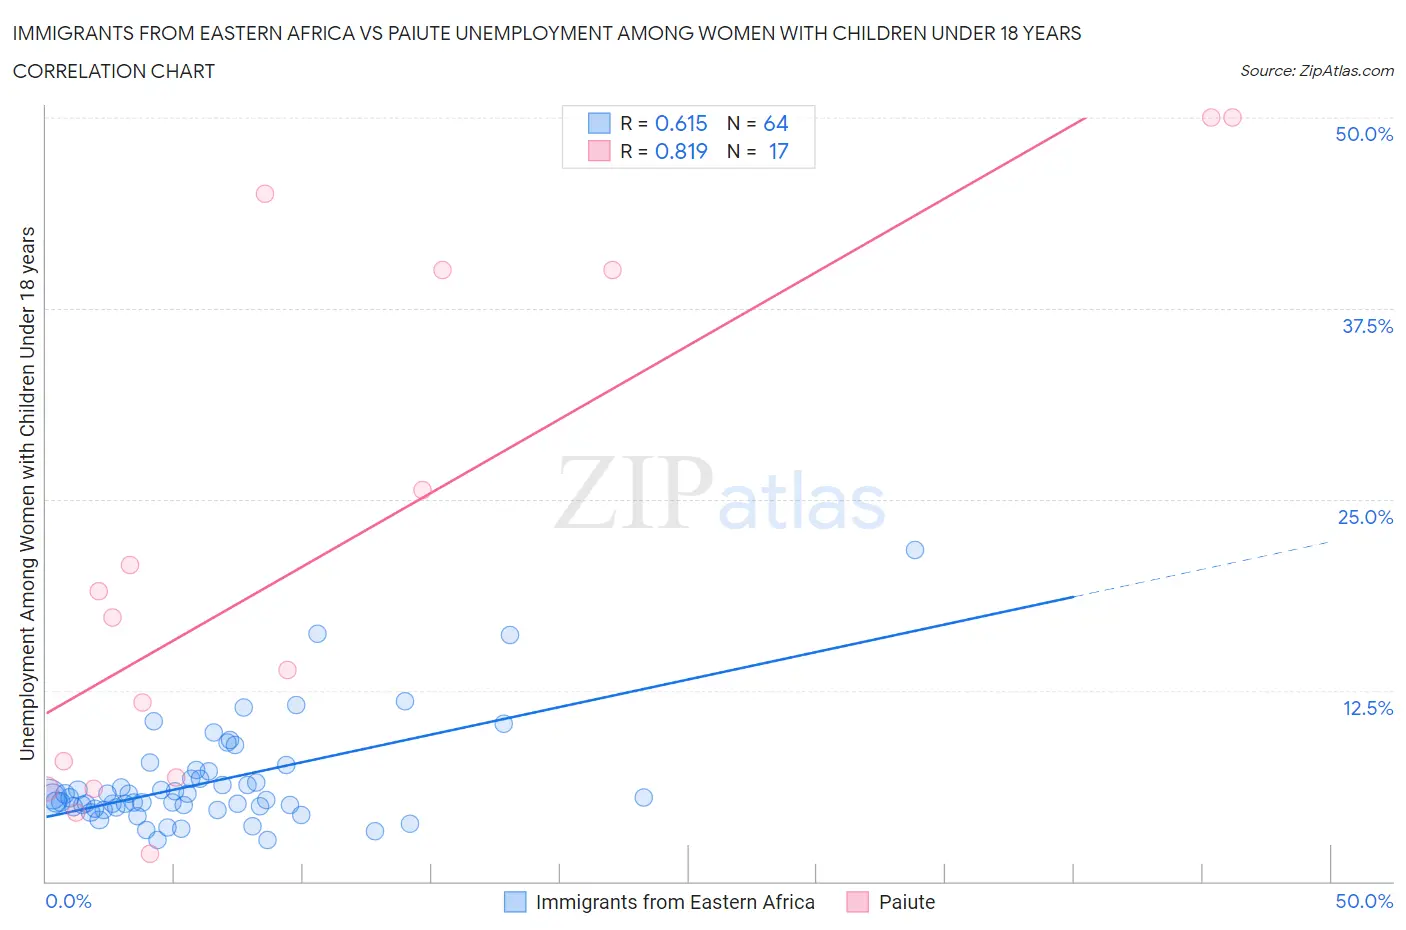
Immigrants from Eastern Africa vs Paiute Unemployment Among Women with Children Under 18 years Correlation Chart
The statistical analysis conducted on geographies consisting of 345,026,115 people shows a significant positive correlation between the proportion of Immigrants from Eastern Africa and unemployment rate among women with children under the age of 18 in the United States with a correlation coefficient (R) of 0.615 and weighted average of 5.4%. Similarly, the statistical analysis conducted on geographies consisting of 57,784,306 people shows a very strong positive correlation between the proportion of Paiute and unemployment rate among women with children under the age of 18 in the United States with a correlation coefficient (R) of 0.819 and weighted average of 6.9%, a difference of 26.6%.
Unemployment Among Women with Children Under 18 years Correlation Summary
| Measurement | Immigrants from Eastern Africa | Paiute |
| Minimum | 2.7% | 1.8% |
| Maximum | 21.7% | 50.0% |
| Range | 19.0% | 48.2% |
| Mean | 6.5% | 21.5% |
| Median | 5.5% | 17.3% |
| Interquartile 25% (IQ1) | 4.8% | 6.4% |
| Interquartile 75% (IQ3) | 6.9% | 40.0% |
| Interquartile Range (IQR) | 2.1% | 33.6% |
| Standard Deviation (Sample) | 3.4% | 17.0% |
| Standard Deviation (Population) | 3.3% | 16.5% |
Similar Demographics by Unemployment Among Women with Children Under 18 years
Demographics Similar to Immigrants from Eastern Africa by Unemployment Among Women with Children Under 18 years
In terms of unemployment among women with children under 18 years, the demographic groups most similar to Immigrants from Eastern Africa are Immigrants from Kazakhstan (5.4%, a difference of 0.030%), Immigrants from Uzbekistan (5.4%, a difference of 0.090%), Immigrants from Philippines (5.4%, a difference of 0.13%), Spanish (5.4%, a difference of 0.16%), and Samoan (5.4%, a difference of 0.20%).
| Demographics | Rating | Rank | Unemployment Among Women with Children Under 18 years |
| Aleuts | 59.4 /100 | #166 | Average 5.4% |
| Immigrants | Denmark | 58.0 /100 | #167 | Average 5.4% |
| Immigrants | Northern Africa | 56.1 /100 | #168 | Average 5.4% |
| Immigrants | Thailand | 55.3 /100 | #169 | Average 5.4% |
| Samoans | 54.1 /100 | #170 | Average 5.4% |
| Immigrants | Philippines | 53.1 /100 | #171 | Average 5.4% |
| Immigrants | Kazakhstan | 51.7 /100 | #172 | Average 5.4% |
| Immigrants | Eastern Africa | 51.3 /100 | #173 | Average 5.4% |
| Immigrants | Uzbekistan | 50.0 /100 | #174 | Average 5.4% |
| Spanish | 49.0 /100 | #175 | Average 5.4% |
| Immigrants | Germany | 48.5 /100 | #176 | Average 5.5% |
| Hawaiians | 46.1 /100 | #177 | Average 5.5% |
| Costa Ricans | 45.2 /100 | #178 | Average 5.5% |
| Syrians | 42.8 /100 | #179 | Average 5.5% |
| Immigrants | Southern Europe | 42.7 /100 | #180 | Average 5.5% |
Demographics Similar to Paiute by Unemployment Among Women with Children Under 18 years
In terms of unemployment among women with children under 18 years, the demographic groups most similar to Paiute are Pueblo (6.8%, a difference of 0.93%), Houma (6.8%, a difference of 1.1%), Immigrants from Dominica (7.0%, a difference of 1.2%), Chippewa (7.0%, a difference of 1.9%), and Lumbee (7.1%, a difference of 2.8%).
| Demographics | Rating | Rank | Unemployment Among Women with Children Under 18 years |
| Shoshone | 0.0 /100 | #317 | Tragic 6.6% |
| Alaska Natives | 0.0 /100 | #318 | Tragic 6.7% |
| Central American Indians | 0.0 /100 | #319 | Tragic 6.7% |
| Immigrants | Belize | 0.0 /100 | #320 | Tragic 6.7% |
| U.S. Virgin Islanders | 0.0 /100 | #321 | Tragic 6.7% |
| Houma | 0.0 /100 | #322 | Tragic 6.8% |
| Pueblo | 0.0 /100 | #323 | Tragic 6.8% |
| Paiute | 0.0 /100 | #324 | Tragic 6.9% |
| Immigrants | Dominica | 0.0 /100 | #325 | Tragic 7.0% |
| Chippewa | 0.0 /100 | #326 | Tragic 7.0% |
| Lumbee | 0.0 /100 | #327 | Tragic 7.1% |
| Natives/Alaskans | 0.0 /100 | #328 | Tragic 7.2% |
| Blacks/African Americans | 0.0 /100 | #329 | Tragic 7.3% |
| Colville | 0.0 /100 | #330 | Tragic 7.4% |
| Hopi | 0.0 /100 | #331 | Tragic 7.4% |