Immigrants from Eastern Africa vs Aleut Unemployment Among Ages 20 to 24 years

COMPARE

Immigrants from Eastern Africa
Race
Ancestry
AfghanAfricanAlaska NativeAlaskan AthabascanAlbanianAlsatianAmericanApacheArabArapahoArgentineanArmenianAssyrian/Chaldean/SyriacAustralianAustrianBahamianBangladeshiBarbadianBasqueBelgianBelizeanBermudanBhutaneseBlackfeetBolivianBrazilianBritishBritish West IndianBulgarianBurmeseCajunCambodianCanadianCape VerdeanCarpatho RusynCelticCentral AmericanCentral American IndianCherokeeCheyenneChickasawChileanChineseChippewaChoctawColombianColvilleComancheCosta RicanCreeCreekCroatianCrowCubanCypriotCzechCzechoslovakianDanishDelawareDominicanDutchDutch West IndianEastern EuropeanEcuadorianEgyptianEnglishEstonianEthiopianEuropeanFijianFilipinoFinnishFrenchFrench American IndianFrench CanadianGermanGerman RussianGhanaianGreekGuamanian/ChamorroGuatemalanGuyaneseHaitianHmongHonduranHopiHoumaHungarianIcelanderIndian (Asian)IndonesianInupiatIranianIraqiIrishIroquoisIsraeliItalianJamaicanJapaneseJordanianKenyanKiowaKoreanLaotianLatvianLebaneseLiberianLithuanianLumbeeLuxembourgerMacedonianMalaysianMalteseMarshalleseMenomineeMexicanMexican American IndianMongolianMoroccanNative HawaiianNavajoNepaleseNew ZealanderNicaraguanNigerianNorthern EuropeanNorwegianOkinawanOsageOttawaPaiutePakistaniPalestinianPanamanianParaguayanPennsylvania GermanPeruvianPimaPolishPortuguesePotawatomiPuebloPuerto RicanPuget Sound SalishRomanianRussianSalvadoranSamoanScandinavianScotch-IrishScottishSeminoleSenegaleseSerbianShoshoneSierra LeoneanSiouxSlavicSlovakSloveneSomaliSouth AfricanSouth AmericanSouth American IndianSoviet UnionSpaniardSpanishSpanish AmericanSpanish American IndianSri LankanSubsaharan AfricanSudaneseSwedishSwissSyrianTaiwaneseThaiTlingit-HaidaTohono O'OdhamTonganTrinidadian and TobagonianTsimshianTurkishU.S. Virgin IslanderUgandanUkrainianUruguayanUteVenezuelanVietnameseWelshWest IndianYakamaYaquiYugoslavianYumanYup'ikZimbabwean
Immigration
NonimmigrantsImmigrantsAfghanistanAfricaAlbaniaArgentinaArmeniaAsiaAustraliaAustriaBahamasBangladeshBarbadosBelarusBelgiumBelizeBoliviaBosnia and HerzegovinaBrazilBulgariaBurma/MyanmarCabo VerdeCambodiaCameroonCanadaCaribbeanCentral AmericaChileChinaColombiaCongoCosta RicaCroatiaCubaCzechoslovakiaDenmarkDominicaDominican RepublicEastern AfricaEastern AsiaEastern EuropeEcuadorEgyptEl SalvadorEnglandEritreaEthiopiaEuropeFijiFranceGermanyGhanaGreeceGrenadaGuatemalaGuyanaHaitiHondurasHong KongHungaryIndiaIndonesiaIranIraqIrelandIsraelItalyJamaicaJapanJordanKazakhstanKenyaKoreaKuwaitLaosLatin AmericaLatviaLebanonLiberiaLithuaniaMalaysiaMexicoMicronesiaMiddle AfricaMoldovaMoroccoNepalNetherlandsNicaraguaNigeriaNorth AmericaNorth MacedoniaNorthern AfricaNorthern EuropeNorwayOceaniaPakistanPanamaPeruPhilippinesPolandPortugalRomaniaRussiaSaudi ArabiaScotlandSenegalSerbiaSierra LeoneSingaporeSomaliaSouth AfricaSouth AmericaSouth Central AsiaSouth Eastern AsiaSouthern EuropeSpainSri LankaSt. Vincent and the GrenadinesSudanSwedenSwitzerlandSyriaTaiwanThailandTrinidad and TobagoTurkeyUgandaUkraineUruguayUzbekistanVenezuelaVietnamWest IndiesWestern AfricaWestern AsiaWestern EuropeYemenZaireZimbabweAzores
Aleut
Race
Ancestry
AfghanAfricanAlaska NativeAlaskan AthabascanAlbanianAleutAlsatianAmericanApacheArabArapahoArgentineanArmenianAssyrian/Chaldean/SyriacAustralianAustrianBahamianBangladeshiBarbadianBasqueBelgianBelizeanBermudanBhutaneseBlackfeetBolivianBrazilianBritishBritish West IndianBulgarianBurmeseCajunCambodianCanadianCape VerdeanCarpatho RusynCelticCentral AmericanCentral American IndianCherokeeCheyenneChickasawChileanChineseChippewaChoctawColombianColvilleComancheCosta RicanCreeCreekCroatianCrowCubanCypriotCzechCzechoslovakianDanishDelawareDominicanDutchDutch West IndianEastern EuropeanEcuadorianEgyptianEnglishEstonianEthiopianEuropeanFijianFilipinoFinnishFrenchFrench American IndianFrench CanadianGermanGerman RussianGhanaianGreekGuamanian/ChamorroGuatemalanGuyaneseHaitianHmongHonduranHopiHoumaHungarianIcelanderIndian (Asian)IndonesianInupiatIranianIraqiIrishIroquoisIsraeliItalianJamaicanJapaneseJordanianKenyanKiowaKoreanLaotianLatvianLebaneseLiberianLithuanianLumbeeLuxembourgerMacedonianMalaysianMalteseMarshalleseMenomineeMexicanMexican American IndianMongolianMoroccanNative HawaiianNavajoNepaleseNew ZealanderNicaraguanNigerianNorthern EuropeanNorwegianOkinawanOsageOttawaPaiutePakistaniPalestinianPanamanianParaguayanPennsylvania GermanPeruvianPimaPolishPortuguesePotawatomiPuebloPuerto RicanPuget Sound SalishRomanianRussianSalvadoranSamoanScandinavianScotch-IrishScottishSeminoleSenegaleseSerbianShoshoneSierra LeoneanSiouxSlavicSlovakSloveneSomaliSouth AfricanSouth AmericanSouth American IndianSoviet UnionSpaniardSpanishSpanish AmericanSpanish American IndianSri LankanSubsaharan AfricanSudaneseSwedishSwissSyrianTaiwaneseThaiTlingit-HaidaTohono O'OdhamTonganTrinidadian and TobagonianTsimshianTurkishU.S. Virgin IslanderUgandanUkrainianUruguayanUteVenezuelanVietnameseWelshWest IndianYakamaYaquiYugoslavianYumanYup'ikZimbabwean
Immigration
NonimmigrantsImmigrantsAfghanistanAfricaAlbaniaArgentinaArmeniaAsiaAustraliaAustriaBahamasBangladeshBarbadosBelarusBelgiumBelizeBoliviaBosnia and HerzegovinaBrazilBulgariaBurma/MyanmarCabo VerdeCambodiaCameroonCanadaCaribbeanCentral AmericaChileChinaColombiaCongoCosta RicaCroatiaCubaCzechoslovakiaDenmarkDominicaDominican RepublicEastern AsiaEastern EuropeEcuadorEgyptEl SalvadorEnglandEritreaEthiopiaEuropeFijiFranceGermanyGhanaGreeceGrenadaGuatemalaGuyanaHaitiHondurasHong KongHungaryIndiaIndonesiaIranIraqIrelandIsraelItalyJamaicaJapanJordanKazakhstanKenyaKoreaKuwaitLaosLatin AmericaLatviaLebanonLiberiaLithuaniaMalaysiaMexicoMicronesiaMiddle AfricaMoldovaMoroccoNepalNetherlandsNicaraguaNigeriaNorth AmericaNorth MacedoniaNorthern AfricaNorthern EuropeNorwayOceaniaPakistanPanamaPeruPhilippinesPolandPortugalRomaniaRussiaSaudi ArabiaScotlandSenegalSerbiaSierra LeoneSingaporeSomaliaSouth AfricaSouth AmericaSouth Central AsiaSouth Eastern AsiaSouthern EuropeSpainSri LankaSt. Vincent and the GrenadinesSudanSwedenSwitzerlandSyriaTaiwanThailandTrinidad and TobagoTurkeyUgandaUkraineUruguayUzbekistanVenezuelaVietnamWest IndiesWestern AfricaWestern AsiaWestern EuropeYemenZaireZimbabweAzores
Unemployment Among Ages 20 to 24 years
Income
Poverty
Unemployment
Labor Participation
Family Structure
Vehicle Availability
Education Level
Disability

Unemployment Among Ages 20 to 24 years Comparison

Immigrants from Eastern Africa

Aleuts

Exceptional
Tragic
9.5%
UNEMPLOYMENT AMONG AGES 20 TO 24 YEARS
100.0/ 100
METRIC RATING
31st/ 347
METRIC RANK
13.8%
UNEMPLOYMENT AMONG AGES 20 TO 24 YEARS
0.0/ 100
METRIC RATING
331st/ 347
METRIC RANK

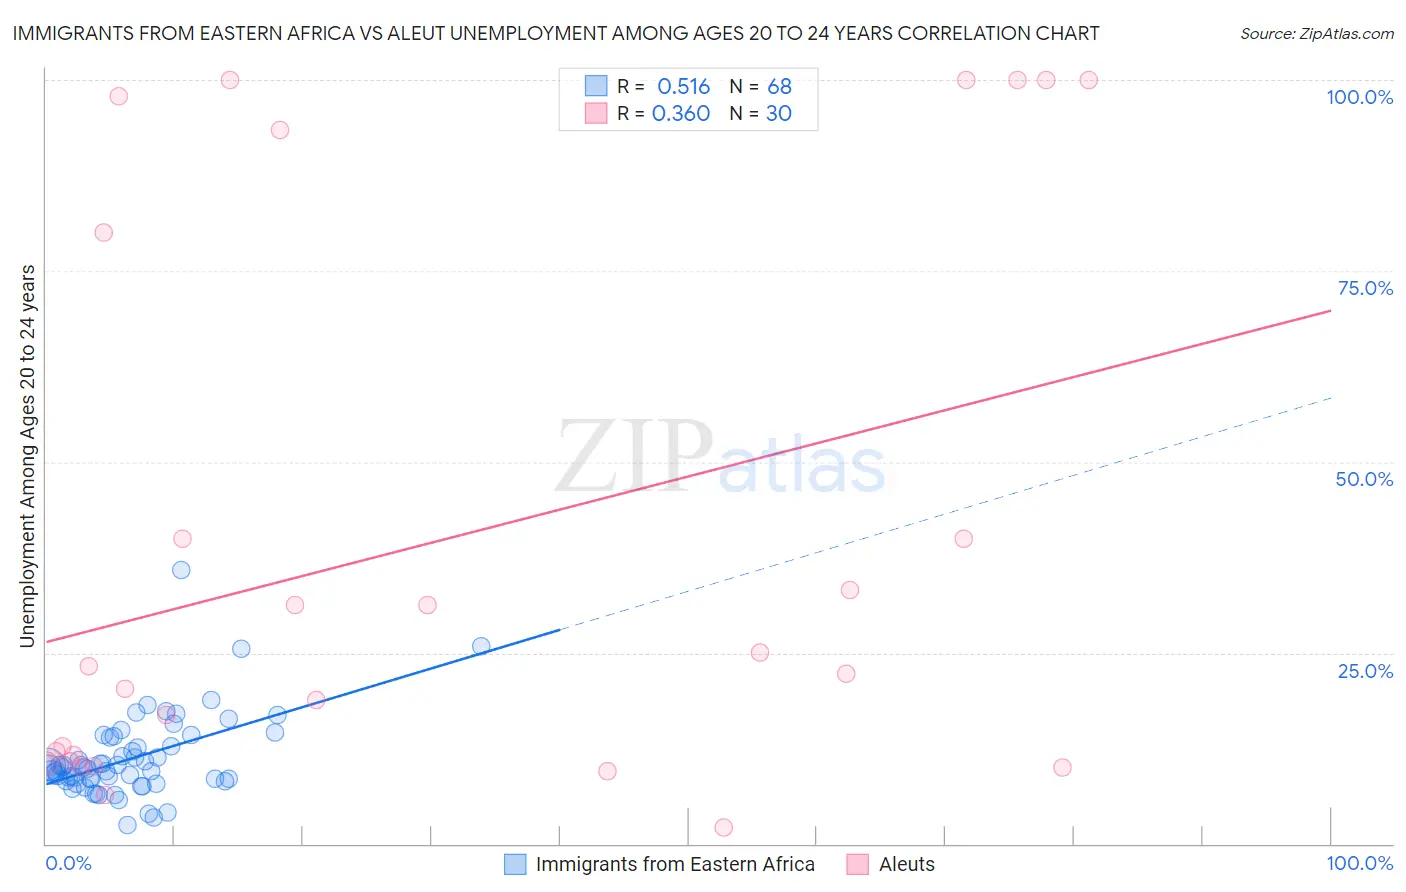
Immigrants from Eastern Africa vs Aleut Unemployment Among Ages 20 to 24 years Correlation Chart

The statistical analysis conducted on geographies consisting of 347,814,596 people shows a substantial positive correlation between the proportion of Immigrants from Eastern Africa and unemployment rate among population between the ages 20 and 24 in the United States with a correlation coefficient (R) of 0.516 and weighted average of 9.5%. Similarly, the statistical analysis conducted on geographies consisting of 61,151,302 people shows a mild positive correlation between the proportion of Aleuts and unemployment rate among population between the ages 20 and 24 in the United States with a correlation coefficient (R) of 0.360 and weighted average of 13.8%, a difference of 45.1%.
Immigrants from Eastern Africa vs Aleut Unemployment Among Ages 20 to 24 years

Unemployment Among Ages 20 to 24 years Correlation Summary

MeasurementImmigrants from Eastern AfricaAleut
Minimum2.5%2.2%
Maximum35.9%100.0%
Range33.4%97.8%
Mean11.1%39.3%
Median9.9%22.7%
Interquartile 25% (IQ1)8.3%10.8%
Interquartile 75% (IQ3)13.3%80.0%
Interquartile Range (IQR)4.9%69.2%
Standard Deviation (Sample)5.4%36.4%
Standard Deviation (Population)5.3%35.8%

Similar Demographics by Unemployment Among Ages 20 to 24 years

Demographics Similar to Immigrants from Eastern Africa by Unemployment Among Ages 20 to 24 years

In terms of unemployment among ages 20 to 24 years, the demographic groups most similar to Immigrants from Eastern Africa are Cambodian (9.5%, a difference of 0.040%), Scandinavian (9.5%, a difference of 0.090%), Immigrants from North Macedonia (9.5%, a difference of 0.10%), Immigrants from Afghanistan (9.5%, a difference of 0.11%), and Australian (9.6%, a difference of 0.16%).
DemographicsRating | RankUnemployment Among Ages 20 to 24 years
Taiwanese
100.0
/100
|
#24
Exceptional
9.4%
Immigrants | Eritrea
100.0
/100
|
#25
Exceptional
9.5%
Swedes
100.0
/100
|
#26
Exceptional
9.5%
Immigrants | Zimbabwe
100.0
/100
|
#27
Exceptional
9.5%
Immigrants | Afghanistan
100.0
/100
|
#28
Exceptional
9.5%
Immigrants | North Macedonia
100.0
/100
|
#29
Exceptional
9.5%
Scandinavians
100.0
/100
|
#30
Exceptional
9.5%
Immigrants | Eastern Africa
100.0
/100
|
#31
Exceptional
9.5%
Cambodians
100.0
/100
|
#32
Exceptional
9.5%
Australians
100.0
/100
|
#33
Exceptional
9.6%
Yugoslavians
100.0
/100
|
#34
Exceptional
9.6%
Germans
100.0
/100
|
#35
Exceptional
9.6%
Belgians
100.0
/100
|
#36
Exceptional
9.6%
Immigrants | Zaire
100.0
/100
|
#37
Exceptional
9.6%
Afghans
99.9
/100
|
#38
Exceptional
9.6%

Demographics Similar to Aleuts by Unemployment Among Ages 20 to 24 years

In terms of unemployment among ages 20 to 24 years, the demographic groups most similar to Aleuts are Immigrants from Grenada (13.8%, a difference of 0.060%), Arapaho (13.8%, a difference of 0.27%), Dominican (13.8%, a difference of 0.35%), Immigrants from Guyana (13.9%, a difference of 0.58%), and British West Indian (13.7%, a difference of 0.91%).
DemographicsRating | RankUnemployment Among Ages 20 to 24 years
Alaska Natives
0.0
/100
|
#324
Tragic
13.2%
Pueblo
0.0
/100
|
#325
Tragic
13.2%
Immigrants | Barbados
0.0
/100
|
#326
Tragic
13.5%
Immigrants | Dominican Republic
0.0
/100
|
#327
Tragic
13.6%
British West Indians
0.0
/100
|
#328
Tragic
13.7%
Dominicans
0.0
/100
|
#329
Tragic
13.8%
Arapaho
0.0
/100
|
#330
Tragic
13.8%
Aleuts
0.0
/100
|
#331
Tragic
13.8%
Immigrants | Grenada
0.0
/100
|
#332
Tragic
13.8%
Immigrants | Guyana
0.0
/100
|
#333
Tragic
13.9%
Guyanese
0.0
/100
|
#334
Tragic
14.0%
Sioux
0.0
/100
|
#335
Tragic
14.2%
Pima
0.0
/100
|
#336
Tragic
14.2%
Paiute
0.0
/100
|
#337
Tragic
14.3%
Immigrants | St. Vincent and the Grenadines
0.0
/100
|
#338
Tragic
14.3%