Immigrants from Dominican Republic vs Immigrants from Bolivia Unemployment Among Ages 30 to 34 years
COMPARE
Immigrants from Dominican Republic
Immigrants from Bolivia
Unemployment Among Ages 30 to 34 years
Unemployment Among Ages 30 to 34 years Comparison
Immigrants from Dominican Republic
Immigrants from Bolivia
7.7%
UNEMPLOYMENT AMONG AGES 30 TO 34 YEARS
0.0/ 100
METRIC RATING
327th/ 347
METRIC RANK
4.8%
UNEMPLOYMENT AMONG AGES 30 TO 34 YEARS
99.9/ 100
METRIC RATING
11th/ 347
METRIC RANK
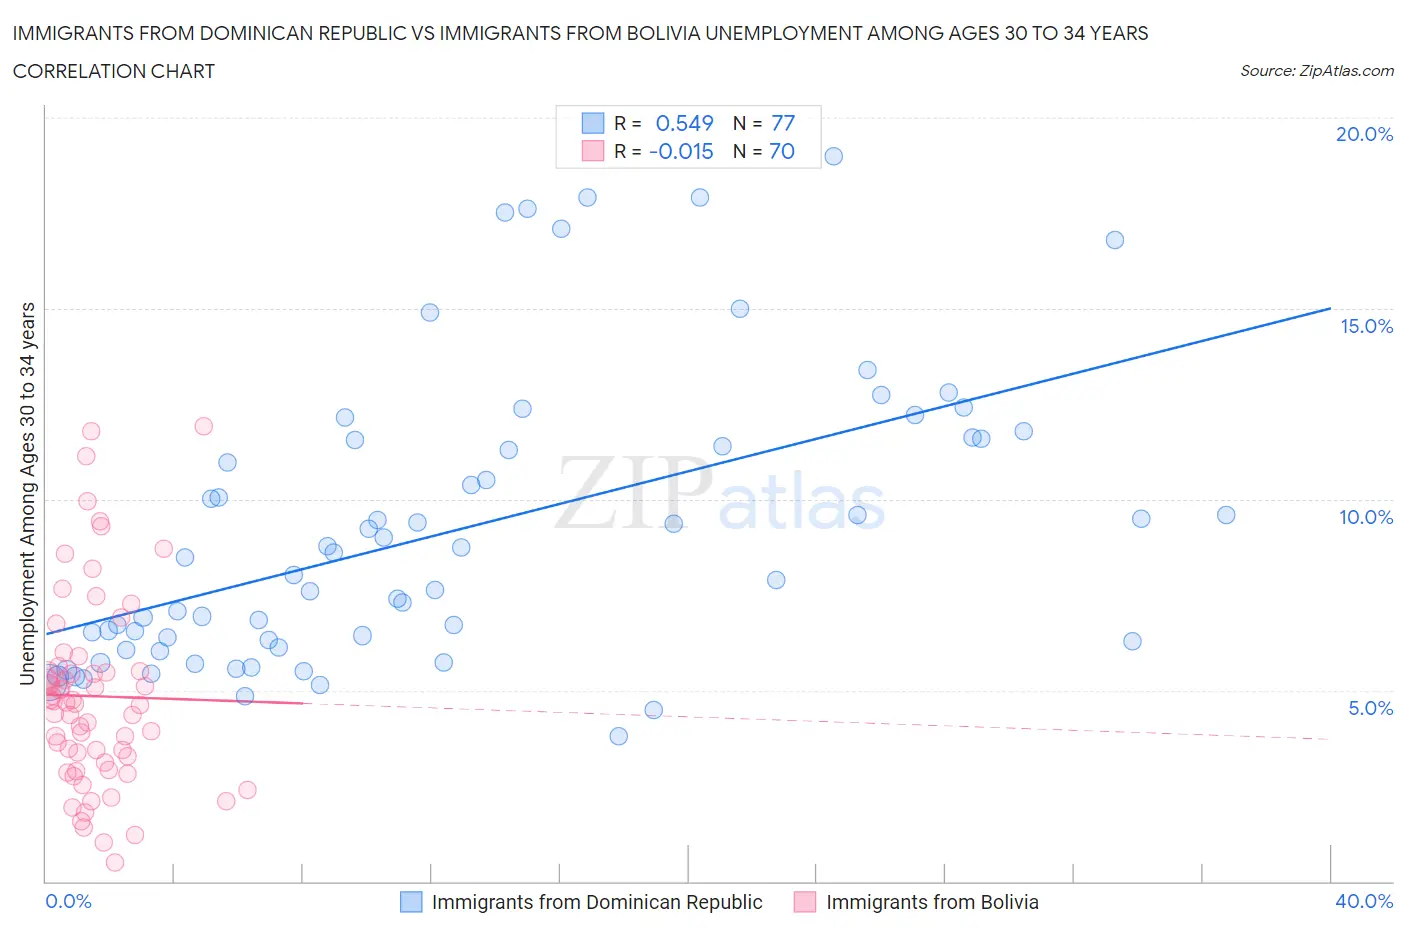
Immigrants from Dominican Republic vs Immigrants from Bolivia Unemployment Among Ages 30 to 34 years Correlation Chart
The statistical analysis conducted on geographies consisting of 263,148,059 people shows a substantial positive correlation between the proportion of Immigrants from Dominican Republic and unemployment rate among population between the ages 30 and 34 in the United States with a correlation coefficient (R) of 0.549 and weighted average of 7.7%. Similarly, the statistical analysis conducted on geographies consisting of 155,484,610 people shows no correlation between the proportion of Immigrants from Bolivia and unemployment rate among population between the ages 30 and 34 in the United States with a correlation coefficient (R) of -0.015 and weighted average of 4.8%, a difference of 62.8%.
Unemployment Among Ages 30 to 34 years Correlation Summary
| Measurement | Immigrants from Dominican Republic | Immigrants from Bolivia |
| Minimum | 3.8% | 0.50% |
| Maximum | 19.0% | 11.9% |
| Range | 15.2% | 11.4% |
| Mean | 9.2% | 4.8% |
| Median | 8.5% | 4.7% |
| Interquartile 25% (IQ1) | 6.2% | 3.1% |
| Interquartile 75% (IQ3) | 11.6% | 5.5% |
| Interquartile Range (IQR) | 5.4% | 2.4% |
| Standard Deviation (Sample) | 3.8% | 2.5% |
| Standard Deviation (Population) | 3.7% | 2.5% |
Similar Demographics by Unemployment Among Ages 30 to 34 years
Demographics Similar to Immigrants from Dominican Republic by Unemployment Among Ages 30 to 34 years
In terms of unemployment among ages 30 to 34 years, the demographic groups most similar to Immigrants from Dominican Republic are Chippewa (7.8%, a difference of 0.27%), Dominican (7.7%, a difference of 0.72%), Cheyenne (7.8%, a difference of 1.3%), Shoshone (7.9%, a difference of 2.3%), and Sioux (8.0%, a difference of 3.7%).
| Demographics | Rating | Rank | Unemployment Among Ages 30 to 34 years |
| Cape Verdeans | 0.0 /100 | #320 | Tragic 7.2% |
| Immigrants | Guyana | 0.0 /100 | #321 | Tragic 7.2% |
| Marshallese | 0.0 /100 | #322 | Tragic 7.2% |
| Immigrants | Yemen | 0.0 /100 | #323 | Tragic 7.3% |
| Immigrants | Dominica | 0.0 /100 | #324 | Tragic 7.3% |
| Apache | 0.0 /100 | #325 | Tragic 7.3% |
| Dominicans | 0.0 /100 | #326 | Tragic 7.7% |
| Immigrants | Dominican Republic | 0.0 /100 | #327 | Tragic 7.7% |
| Chippewa | 0.0 /100 | #328 | Tragic 7.8% |
| Cheyenne | 0.0 /100 | #329 | Tragic 7.8% |
| Shoshone | 0.0 /100 | #330 | Tragic 7.9% |
| Sioux | 0.0 /100 | #331 | Tragic 8.0% |
| Natives/Alaskans | 0.0 /100 | #332 | Tragic 8.2% |
| Pueblo | 0.0 /100 | #333 | Tragic 8.3% |
| Alaska Natives | 0.0 /100 | #334 | Tragic 8.5% |
Demographics Similar to Immigrants from Bolivia by Unemployment Among Ages 30 to 34 years
In terms of unemployment among ages 30 to 34 years, the demographic groups most similar to Immigrants from Bolivia are Tongan (4.8%, a difference of 0.030%), Bulgarian (4.7%, a difference of 0.21%), Immigrants from Eritrea (4.7%, a difference of 0.52%), Thai (4.7%, a difference of 0.70%), and Immigrants from Bosnia and Herzegovina (4.7%, a difference of 0.90%).
| Demographics | Rating | Rank | Unemployment Among Ages 30 to 34 years |
| Immigrants | Nepal | 100.0 /100 | #4 | Exceptional 4.7% |
| Venezuelans | 100.0 /100 | #5 | Exceptional 4.7% |
| Immigrants | Bosnia and Herzegovina | 100.0 /100 | #6 | Exceptional 4.7% |
| Thais | 100.0 /100 | #7 | Exceptional 4.7% |
| Immigrants | Eritrea | 100.0 /100 | #8 | Exceptional 4.7% |
| Bulgarians | 99.9 /100 | #9 | Exceptional 4.7% |
| Tongans | 99.9 /100 | #10 | Exceptional 4.8% |
| Immigrants | Bolivia | 99.9 /100 | #11 | Exceptional 4.8% |
| Filipinos | 99.9 /100 | #12 | Exceptional 4.8% |
| Cambodians | 99.9 /100 | #13 | Exceptional 4.8% |
| Luxembourgers | 99.9 /100 | #14 | Exceptional 4.8% |
| Okinawans | 99.9 /100 | #15 | Exceptional 4.8% |
| Zimbabweans | 99.9 /100 | #16 | Exceptional 4.8% |
| Immigrants | Bulgaria | 99.9 /100 | #17 | Exceptional 4.8% |
| Bolivians | 99.8 /100 | #18 | Exceptional 4.9% |