Immigrants from Dominican Republic vs Croatian Unemployment Among Seniors over 65 years
COMPARE
Immigrants from Dominican Republic
Croatian
Unemployment Among Seniors over 65 years
Unemployment Among Seniors over 65 years Comparison
Immigrants from Dominican Republic
Croatians
6.0%
UNEMPLOYMENT AMONG SENIORS OVER 65 YEARS
0.0/ 100
METRIC RATING
333rd/ 347
METRIC RANK
4.9%
UNEMPLOYMENT AMONG SENIORS OVER 65 YEARS
99.6/ 100
METRIC RATING
63rd/ 347
METRIC RANK
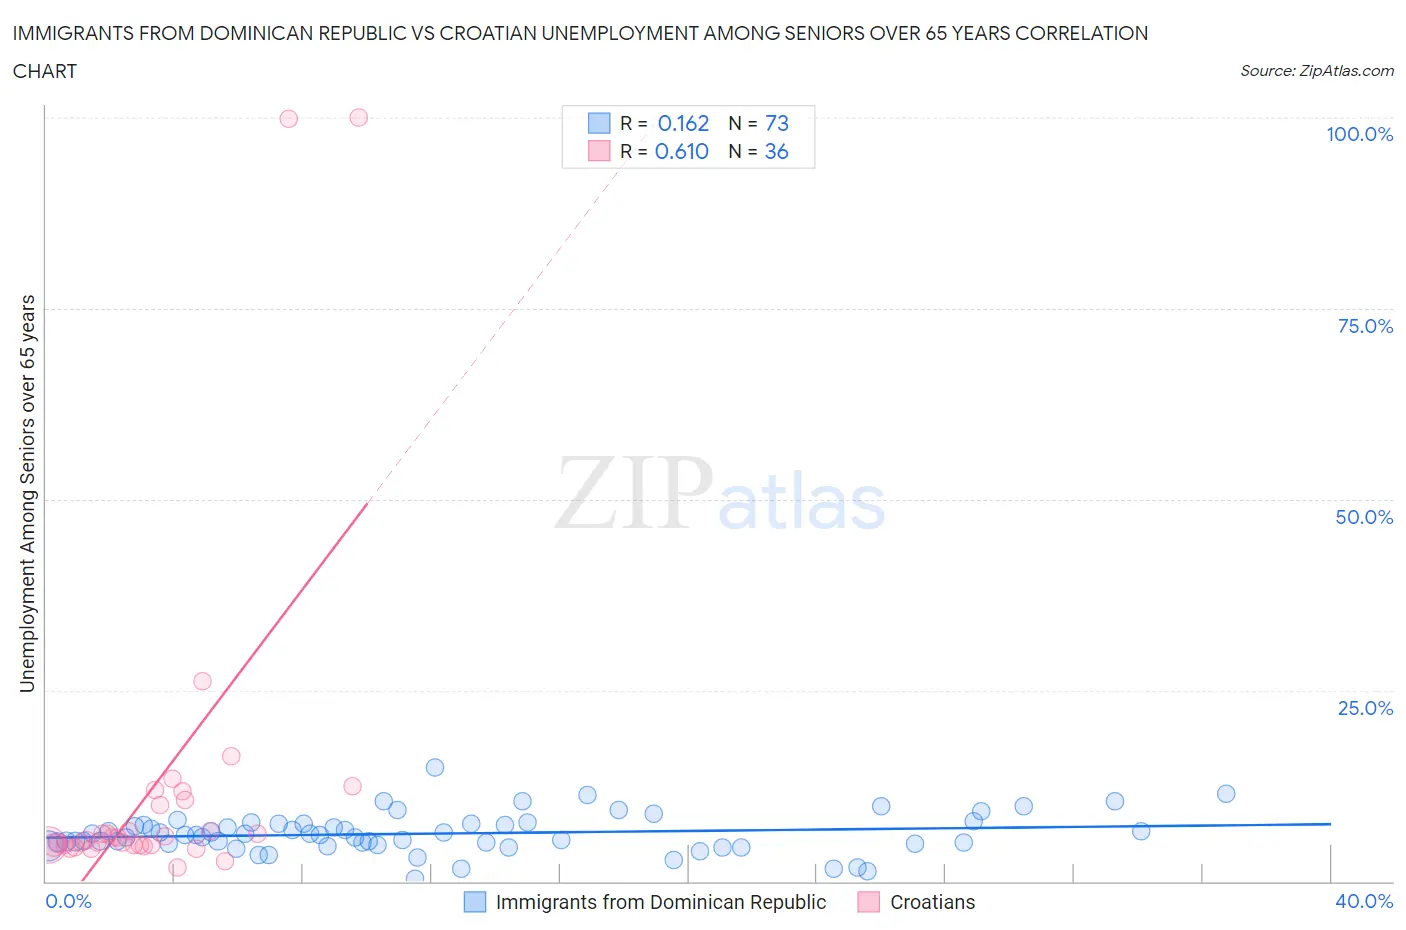
Immigrants from Dominican Republic vs Croatian Unemployment Among Seniors over 65 years Correlation Chart
The statistical analysis conducted on geographies consisting of 254,579,776 people shows a poor positive correlation between the proportion of Immigrants from Dominican Republic and unemployment rate amomg seniors over the age of 65 in the United States with a correlation coefficient (R) of 0.162 and weighted average of 6.0%. Similarly, the statistical analysis conducted on geographies consisting of 337,883,351 people shows a significant positive correlation between the proportion of Croatians and unemployment rate amomg seniors over the age of 65 in the United States with a correlation coefficient (R) of 0.610 and weighted average of 4.9%, a difference of 22.2%.
Unemployment Among Seniors over 65 years Correlation Summary
| Measurement | Immigrants from Dominican Republic | Croatian |
| Minimum | 0.40% | 1.8% |
| Maximum | 14.9% | 100.0% |
| Range | 14.5% | 98.2% |
| Mean | 6.2% | 12.3% |
| Median | 6.1% | 5.6% |
| Interquartile 25% (IQ1) | 4.9% | 4.8% |
| Interquartile 75% (IQ3) | 7.5% | 10.4% |
| Interquartile Range (IQR) | 2.6% | 5.6% |
| Standard Deviation (Sample) | 2.5% | 22.0% |
| Standard Deviation (Population) | 2.5% | 21.7% |
Similar Demographics by Unemployment Among Seniors over 65 years
Demographics Similar to Immigrants from Dominican Republic by Unemployment Among Seniors over 65 years
In terms of unemployment among seniors over 65 years, the demographic groups most similar to Immigrants from Dominican Republic are Aleut (6.0%, a difference of 0.55%), Taiwanese (6.0%, a difference of 0.60%), Immigrants from Portugal (6.0%, a difference of 0.75%), Dominican (6.0%, a difference of 0.77%), and Puerto Rican (5.9%, a difference of 1.5%).
| Demographics | Rating | Rank | Unemployment Among Seniors over 65 years |
| Shoshone | 0.0 /100 | #326 | Tragic 5.9% |
| Bermudans | 0.0 /100 | #327 | Tragic 5.9% |
| Puerto Ricans | 0.0 /100 | #328 | Tragic 5.9% |
| Dominicans | 0.0 /100 | #329 | Tragic 6.0% |
| Immigrants | Portugal | 0.0 /100 | #330 | Tragic 6.0% |
| Taiwanese | 0.0 /100 | #331 | Tragic 6.0% |
| Aleuts | 0.0 /100 | #332 | Tragic 6.0% |
| Immigrants | Dominican Republic | 0.0 /100 | #333 | Tragic 6.0% |
| Tohono O'odham | 0.0 /100 | #334 | Tragic 6.1% |
| Immigrants | Armenia | 0.0 /100 | #335 | Tragic 6.2% |
| Pima | 0.0 /100 | #336 | Tragic 6.3% |
| Alaska Natives | 0.0 /100 | #337 | Tragic 6.3% |
| Immigrants | Azores | 0.0 /100 | #338 | Tragic 6.3% |
| Paiute | 0.0 /100 | #339 | Tragic 6.3% |
| Ute | 0.0 /100 | #340 | Tragic 6.3% |
Demographics Similar to Croatians by Unemployment Among Seniors over 65 years
In terms of unemployment among seniors over 65 years, the demographic groups most similar to Croatians are Immigrants from Cambodia (4.9%, a difference of 0.0%), Latvian (4.9%, a difference of 0.020%), Immigrants from Nicaragua (4.9%, a difference of 0.090%), English (4.9%, a difference of 0.13%), and Iroquois (4.9%, a difference of 0.16%).
| Demographics | Rating | Rank | Unemployment Among Seniors over 65 years |
| Carpatho Rusyns | 99.8 /100 | #56 | Exceptional 4.9% |
| Danes | 99.8 /100 | #57 | Exceptional 4.9% |
| Scandinavians | 99.8 /100 | #58 | Exceptional 4.9% |
| Immigrants | Eastern Africa | 99.7 /100 | #59 | Exceptional 4.9% |
| Immigrants | Middle Africa | 99.7 /100 | #60 | Exceptional 4.9% |
| Northern Europeans | 99.7 /100 | #61 | Exceptional 4.9% |
| Latvians | 99.6 /100 | #62 | Exceptional 4.9% |
| Croatians | 99.6 /100 | #63 | Exceptional 4.9% |
| Immigrants | Cambodia | 99.6 /100 | #64 | Exceptional 4.9% |
| Immigrants | Nicaragua | 99.6 /100 | #65 | Exceptional 4.9% |
| English | 99.5 /100 | #66 | Exceptional 4.9% |
| Iroquois | 99.5 /100 | #67 | Exceptional 4.9% |
| Bolivians | 99.5 /100 | #68 | Exceptional 4.9% |
| Scottish | 99.5 /100 | #69 | Exceptional 4.9% |
| Immigrants | Kazakhstan | 99.4 /100 | #70 | Exceptional 4.9% |