Immigrants from Dominica vs Liberian Unemployment Among Seniors over 65 years
COMPARE
Immigrants from Dominica
Liberian
Unemployment Among Seniors over 65 years
Unemployment Among Seniors over 65 years Comparison
Immigrants from Dominica
Liberians
5.8%
UNEMPLOYMENT AMONG SENIORS OVER 65 YEARS
0.0/ 100
METRIC RATING
323rd/ 347
METRIC RANK
5.6%
UNEMPLOYMENT AMONG SENIORS OVER 65 YEARS
0.0/ 100
METRIC RATING
304th/ 347
METRIC RANK
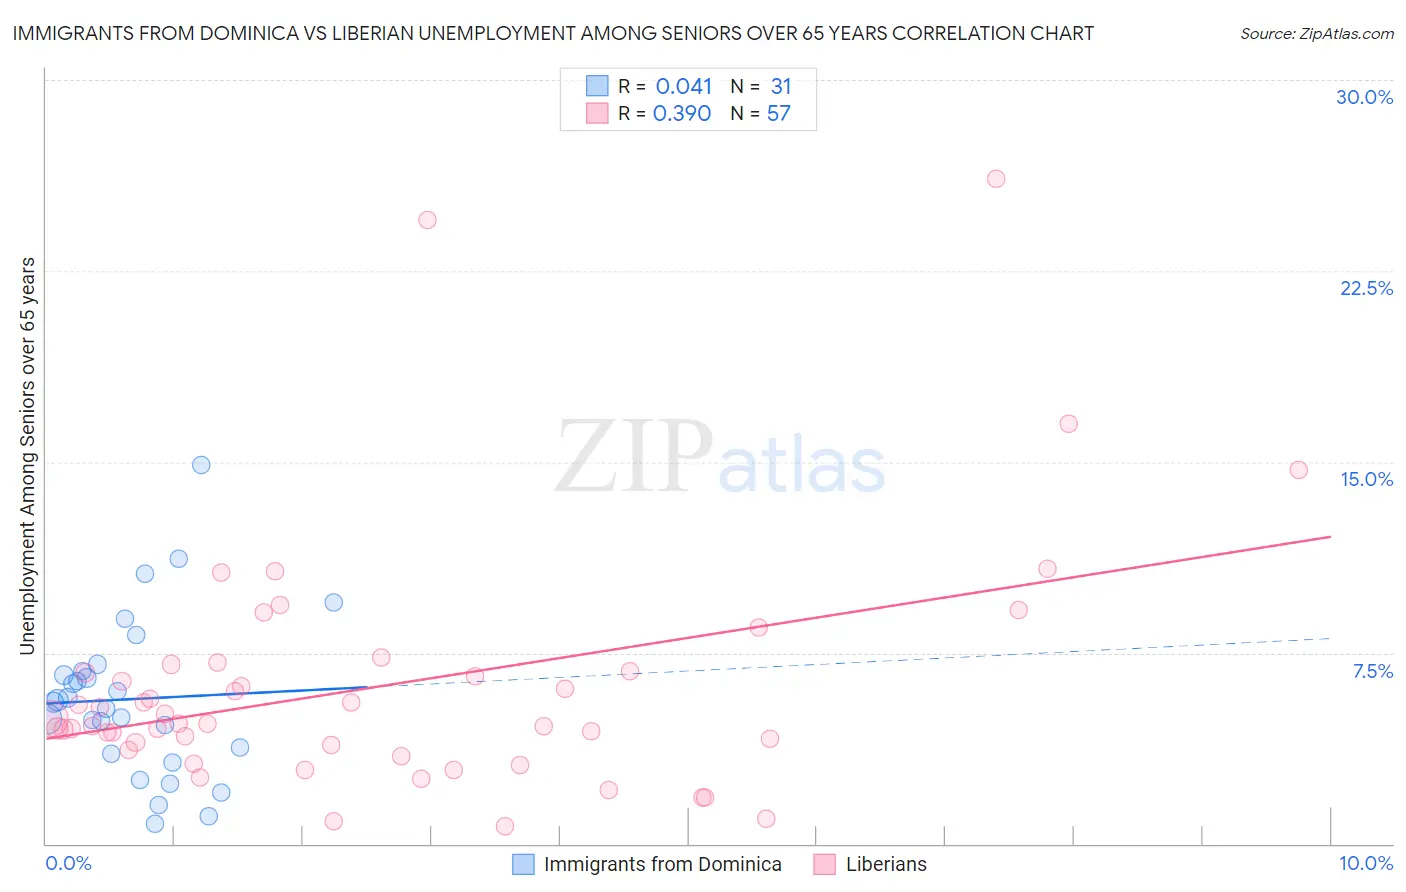
Immigrants from Dominica vs Liberian Unemployment Among Seniors over 65 years Correlation Chart
The statistical analysis conducted on geographies consisting of 81,739,326 people shows no correlation between the proportion of Immigrants from Dominica and unemployment rate amomg seniors over the age of 65 in the United States with a correlation coefficient (R) of 0.041 and weighted average of 5.8%. Similarly, the statistical analysis conducted on geographies consisting of 113,645,931 people shows a mild positive correlation between the proportion of Liberians and unemployment rate amomg seniors over the age of 65 in the United States with a correlation coefficient (R) of 0.390 and weighted average of 5.6%, a difference of 3.6%.
Unemployment Among Seniors over 65 years Correlation Summary
| Measurement | Immigrants from Dominica | Liberian |
| Minimum | 0.80% | 0.70% |
| Maximum | 14.9% | 26.1% |
| Range | 14.1% | 25.4% |
| Mean | 5.7% | 6.2% |
| Median | 5.6% | 4.7% |
| Interquartile 25% (IQ1) | 3.5% | 3.8% |
| Interquartile 75% (IQ3) | 6.8% | 6.9% |
| Interquartile Range (IQR) | 3.3% | 3.1% |
| Standard Deviation (Sample) | 3.1% | 4.8% |
| Standard Deviation (Population) | 3.1% | 4.7% |
Demographics Similar to Immigrants from Dominica and Liberians by Unemployment Among Seniors over 65 years
In terms of unemployment among seniors over 65 years, the demographic groups most similar to Immigrants from Dominica are Native/Alaskan (5.8%, a difference of 0.34%), British West Indian (5.8%, a difference of 0.42%), Immigrants from Mexico (5.7%, a difference of 1.1%), Immigrants from Bangladesh (5.7%, a difference of 1.2%), and Vietnamese (5.7%, a difference of 1.5%). Similarly, the demographic groups most similar to Liberians are Immigrants from Latin America (5.6%, a difference of 0.070%), Mexican (5.6%, a difference of 0.16%), Ecuadorian (5.6%, a difference of 0.21%), Portuguese (5.6%, a difference of 0.25%), and Immigrants from St. Vincent and the Grenadines (5.6%, a difference of 0.34%).
| Demographics | Rating | Rank | Unemployment Among Seniors over 65 years |
| Immigrants | Latin America | 0.0 /100 | #303 | Tragic 5.6% |
| Liberians | 0.0 /100 | #304 | Tragic 5.6% |
| Mexicans | 0.0 /100 | #305 | Tragic 5.6% |
| Ecuadorians | 0.0 /100 | #306 | Tragic 5.6% |
| Portuguese | 0.0 /100 | #307 | Tragic 5.6% |
| Immigrants | St. Vincent and the Grenadines | 0.0 /100 | #308 | Tragic 5.6% |
| Immigrants | Guatemala | 0.0 /100 | #309 | Tragic 5.6% |
| Salvadorans | 0.0 /100 | #310 | Tragic 5.6% |
| Immigrants | Guyana | 0.0 /100 | #311 | Tragic 5.6% |
| Immigrants | Ecuador | 0.0 /100 | #312 | Tragic 5.6% |
| Barbadians | 0.0 /100 | #313 | Tragic 5.6% |
| Delaware | 0.0 /100 | #314 | Tragic 5.7% |
| Immigrants | El Salvador | 0.0 /100 | #315 | Tragic 5.7% |
| Immigrants | Central America | 0.0 /100 | #316 | Tragic 5.7% |
| Immigrants | Bahamas | 0.0 /100 | #317 | Tragic 5.7% |
| Vietnamese | 0.0 /100 | #318 | Tragic 5.7% |
| Immigrants | Bangladesh | 0.0 /100 | #319 | Tragic 5.7% |
| Immigrants | Mexico | 0.0 /100 | #320 | Tragic 5.7% |
| British West Indians | 0.0 /100 | #321 | Tragic 5.8% |
| Natives/Alaskans | 0.0 /100 | #322 | Tragic 5.8% |
| Immigrants | Dominica | 0.0 /100 | #323 | Tragic 5.8% |