Immigrants from Dominica vs Immigrants from Ireland Unemployment Among Ages 16 to 19 years
COMPARE
Immigrants from Dominica
Immigrants from Ireland
Unemployment Among Ages 16 to 19 years
Unemployment Among Ages 16 to 19 years Comparison
Immigrants from Dominica
Immigrants from Ireland
21.9%
UNEMPLOYMENT AMONG AGES 16 TO 19 YEARS
0.0/ 100
METRIC RATING
315th/ 347
METRIC RANK
17.8%
UNEMPLOYMENT AMONG AGES 16 TO 19 YEARS
28.5/ 100
METRIC RATING
199th/ 347
METRIC RANK
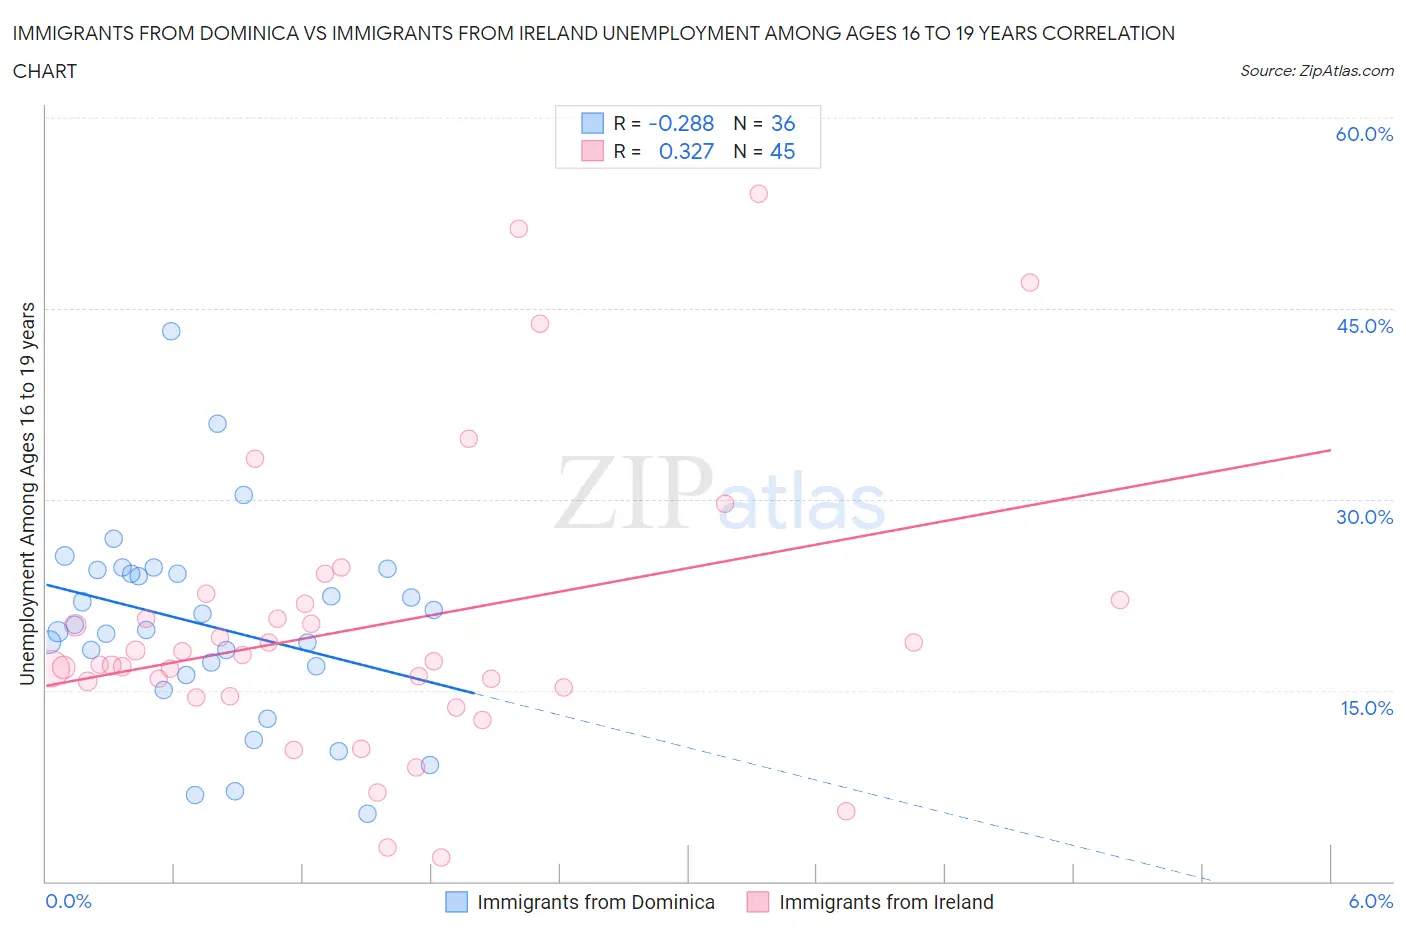
Immigrants from Dominica vs Immigrants from Ireland Unemployment Among Ages 16 to 19 years Correlation Chart
The statistical analysis conducted on geographies consisting of 82,974,472 people shows a weak negative correlation between the proportion of Immigrants from Dominica and unemployment rate among population between the ages 16 and 19 in the United States with a correlation coefficient (R) of -0.288 and weighted average of 21.9%. Similarly, the statistical analysis conducted on geographies consisting of 230,161,155 people shows a mild positive correlation between the proportion of Immigrants from Ireland and unemployment rate among population between the ages 16 and 19 in the United States with a correlation coefficient (R) of 0.327 and weighted average of 17.8%, a difference of 23.5%.
Unemployment Among Ages 16 to 19 years Correlation Summary
| Measurement | Immigrants from Dominica | Immigrants from Ireland |
| Minimum | 5.3% | 1.9% |
| Maximum | 43.2% | 54.0% |
| Range | 37.9% | 52.1% |
| Mean | 20.1% | 20.0% |
| Median | 19.9% | 17.3% |
| Interquartile 25% (IQ1) | 16.6% | 14.9% |
| Interquartile 75% (IQ3) | 24.3% | 21.9% |
| Interquartile Range (IQR) | 7.7% | 7.1% |
| Standard Deviation (Sample) | 7.7% | 11.3% |
| Standard Deviation (Population) | 7.6% | 11.2% |
Similar Demographics by Unemployment Among Ages 16 to 19 years
Demographics Similar to Immigrants from Dominica by Unemployment Among Ages 16 to 19 years
In terms of unemployment among ages 16 to 19 years, the demographic groups most similar to Immigrants from Dominica are Tohono O'odham (22.1%, a difference of 0.54%), Alaska Native (21.8%, a difference of 0.85%), Immigrants from Belize (22.2%, a difference of 0.99%), Jamaican (21.7%, a difference of 1.0%), and Immigrants from Jamaica (22.2%, a difference of 1.1%).
| Demographics | Rating | Rank | Unemployment Among Ages 16 to 19 years |
| Immigrants | Bangladesh | 0.0 /100 | #308 | Tragic 21.5% |
| Natives/Alaskans | 0.0 /100 | #309 | Tragic 21.5% |
| Vietnamese | 0.0 /100 | #310 | Tragic 21.5% |
| Belizeans | 0.0 /100 | #311 | Tragic 21.6% |
| Houma | 0.0 /100 | #312 | Tragic 21.6% |
| Jamaicans | 0.0 /100 | #313 | Tragic 21.7% |
| Alaska Natives | 0.0 /100 | #314 | Tragic 21.8% |
| Immigrants | Dominica | 0.0 /100 | #315 | Tragic 21.9% |
| Tohono O'odham | 0.0 /100 | #316 | Tragic 22.1% |
| Immigrants | Belize | 0.0 /100 | #317 | Tragic 22.2% |
| Immigrants | Jamaica | 0.0 /100 | #318 | Tragic 22.2% |
| Immigrants | West Indies | 0.0 /100 | #319 | Tragic 22.2% |
| Cheyenne | 0.0 /100 | #320 | Tragic 22.3% |
| West Indians | 0.0 /100 | #321 | Tragic 22.4% |
| Barbadians | 0.0 /100 | #322 | Tragic 22.5% |
Demographics Similar to Immigrants from Ireland by Unemployment Among Ages 16 to 19 years
In terms of unemployment among ages 16 to 19 years, the demographic groups most similar to Immigrants from Ireland are Immigrants from Fiji (17.8%, a difference of 0.050%), Ethiopian (17.8%, a difference of 0.060%), Immigrants from Czechoslovakia (17.8%, a difference of 0.070%), Immigrants from Ethiopia (17.8%, a difference of 0.070%), and Immigrants from Portugal (17.8%, a difference of 0.080%).
| Demographics | Rating | Rank | Unemployment Among Ages 16 to 19 years |
| Immigrants | Philippines | 40.7 /100 | #192 | Average 17.7% |
| Immigrants | Australia | 40.6 /100 | #193 | Average 17.7% |
| Peruvians | 38.8 /100 | #194 | Fair 17.7% |
| Immigrants | Peru | 37.3 /100 | #195 | Fair 17.7% |
| Alaskan Athabascans | 34.1 /100 | #196 | Fair 17.7% |
| Immigrants | Czechoslovakia | 29.8 /100 | #197 | Fair 17.8% |
| Ethiopians | 29.6 /100 | #198 | Fair 17.8% |
| Immigrants | Ireland | 28.5 /100 | #199 | Fair 17.8% |
| Immigrants | Fiji | 27.7 /100 | #200 | Fair 17.8% |
| Immigrants | Ethiopia | 27.4 /100 | #201 | Fair 17.8% |
| Immigrants | Portugal | 27.2 /100 | #202 | Fair 17.8% |
| Immigrants | Eastern Europe | 23.6 /100 | #203 | Fair 17.8% |
| Immigrants | Nonimmigrants | 20.9 /100 | #204 | Fair 17.9% |
| Assyrians/Chaldeans/Syriacs | 20.8 /100 | #205 | Fair 17.9% |
| Immigrants | Southern Europe | 18.9 /100 | #206 | Poor 17.9% |