Immigrants from Denmark vs Turkish Unemployment
COMPARE
Immigrants from Denmark
Turkish
Unemployment
Unemployment Comparison
Immigrants from Denmark
Turks
5.1%
UNEMPLOYMENT
84.3/ 100
METRIC RATING
140th/ 347
METRIC RANK
4.9%
UNEMPLOYMENT
98.0/ 100
METRIC RATING
75th/ 347
METRIC RANK
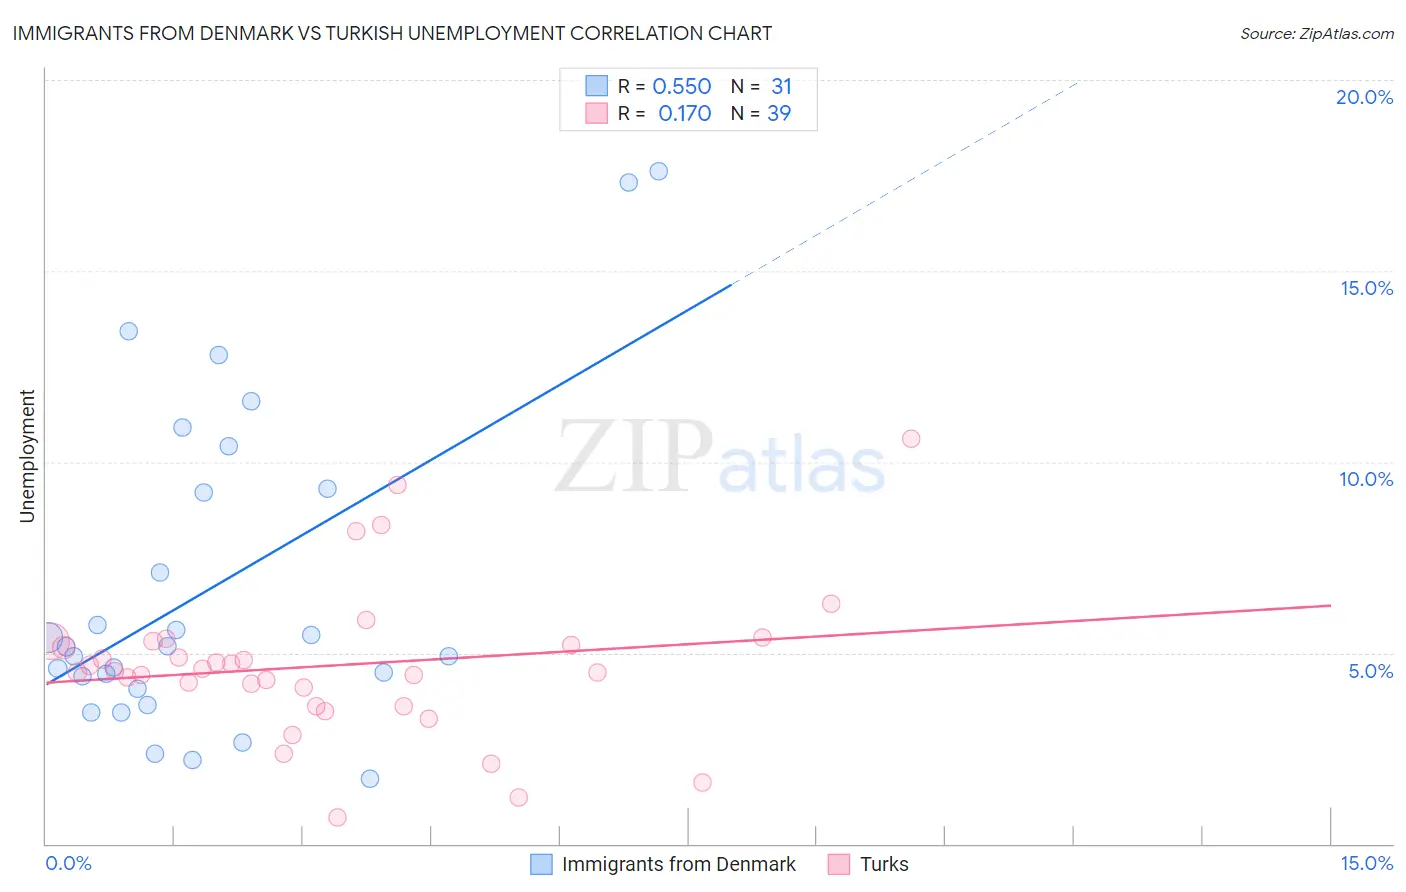
Immigrants from Denmark vs Turkish Unemployment Correlation Chart
The statistical analysis conducted on geographies consisting of 136,363,716 people shows a substantial positive correlation between the proportion of Immigrants from Denmark and unemployment in the United States with a correlation coefficient (R) of 0.550 and weighted average of 5.1%. Similarly, the statistical analysis conducted on geographies consisting of 271,755,353 people shows a poor positive correlation between the proportion of Turks and unemployment in the United States with a correlation coefficient (R) of 0.170 and weighted average of 4.9%, a difference of 3.6%.
Unemployment Correlation Summary
| Measurement | Immigrants from Denmark | Turkish |
| Minimum | 1.7% | 0.70% |
| Maximum | 17.6% | 10.6% |
| Range | 15.9% | 9.9% |
| Mean | 6.7% | 4.7% |
| Median | 5.2% | 4.5% |
| Interquartile 25% (IQ1) | 4.0% | 3.6% |
| Interquartile 75% (IQ3) | 9.3% | 5.3% |
| Interquartile Range (IQR) | 5.3% | 1.7% |
| Standard Deviation (Sample) | 4.2% | 2.0% |
| Standard Deviation (Population) | 4.2% | 2.0% |
Similar Demographics by Unemployment
Demographics Similar to Immigrants from Denmark by Unemployment
In terms of unemployment, the demographic groups most similar to Immigrants from Denmark are Palestinian (5.1%, a difference of 0.11%), Immigrants from Pakistan (5.1%, a difference of 0.12%), Pakistani (5.1%, a difference of 0.13%), Immigrants from Hungary (5.1%, a difference of 0.16%), and Immigrants from Saudi Arabia (5.1%, a difference of 0.17%).
| Demographics | Rating | Rank | Unemployment |
| Immigrants | Jordan | 86.6 /100 | #133 | Excellent 5.1% |
| Immigrants | Europe | 86.3 /100 | #134 | Excellent 5.1% |
| Immigrants | Burma/Myanmar | 86.2 /100 | #135 | Excellent 5.1% |
| Immigrants | Spain | 86.2 /100 | #136 | Excellent 5.1% |
| Immigrants | Saudi Arabia | 85.6 /100 | #137 | Excellent 5.1% |
| Immigrants | Hungary | 85.6 /100 | #138 | Excellent 5.1% |
| Pakistanis | 85.3 /100 | #139 | Excellent 5.1% |
| Immigrants | Denmark | 84.3 /100 | #140 | Excellent 5.1% |
| Palestinians | 83.4 /100 | #141 | Excellent 5.1% |
| Immigrants | Pakistan | 83.2 /100 | #142 | Excellent 5.1% |
| Immigrants | Chile | 82.8 /100 | #143 | Excellent 5.1% |
| Indonesians | 82.3 /100 | #144 | Excellent 5.1% |
| Immigrants | Norway | 81.8 /100 | #145 | Excellent 5.1% |
| Immigrants | Asia | 81.8 /100 | #146 | Excellent 5.1% |
| Indians (Asian) | 81.6 /100 | #147 | Excellent 5.1% |
Demographics Similar to Turks by Unemployment
In terms of unemployment, the demographic groups most similar to Turks are German Russian (4.9%, a difference of 0.030%), Cypriot (4.9%, a difference of 0.080%), Immigrants from Northern Europe (4.9%, a difference of 0.13%), Okinawan (4.9%, a difference of 0.13%), and Paraguayan (4.9%, a difference of 0.23%).
| Demographics | Rating | Rank | Unemployment |
| Slavs | 98.6 /100 | #68 | Exceptional 4.9% |
| Immigrants | North America | 98.5 /100 | #69 | Exceptional 4.9% |
| Serbians | 98.4 /100 | #70 | Exceptional 4.9% |
| Immigrants | Japan | 98.3 /100 | #71 | Exceptional 4.9% |
| Burmese | 98.3 /100 | #72 | Exceptional 4.9% |
| Paraguayans | 98.3 /100 | #73 | Exceptional 4.9% |
| Immigrants | Northern Europe | 98.2 /100 | #74 | Exceptional 4.9% |
| Turks | 98.0 /100 | #75 | Exceptional 4.9% |
| German Russians | 98.0 /100 | #76 | Exceptional 4.9% |
| Cypriots | 97.9 /100 | #77 | Exceptional 4.9% |
| Okinawans | 97.9 /100 | #78 | Exceptional 4.9% |
| Canadians | 97.7 /100 | #79 | Exceptional 5.0% |
| Immigrants | Sweden | 97.6 /100 | #80 | Exceptional 5.0% |
| Basques | 97.6 /100 | #81 | Exceptional 5.0% |
| Fijians | 97.6 /100 | #82 | Exceptional 5.0% |