Immigrants from Denmark vs Immigrants from England Unemployment Among Youth under 25 years
COMPARE
Immigrants from Denmark
Immigrants from England
Unemployment Among Youth under 25 years
Unemployment Among Youth under 25 years Comparison
Immigrants from Denmark
Immigrants from England
11.6%
UNEMPLOYMENT AMONG YOUTH UNDER 25 YEARS
45.0/ 100
METRIC RATING
177th/ 347
METRIC RANK
11.5%
UNEMPLOYMENT AMONG YOUTH UNDER 25 YEARS
78.1/ 100
METRIC RATING
138th/ 347
METRIC RANK
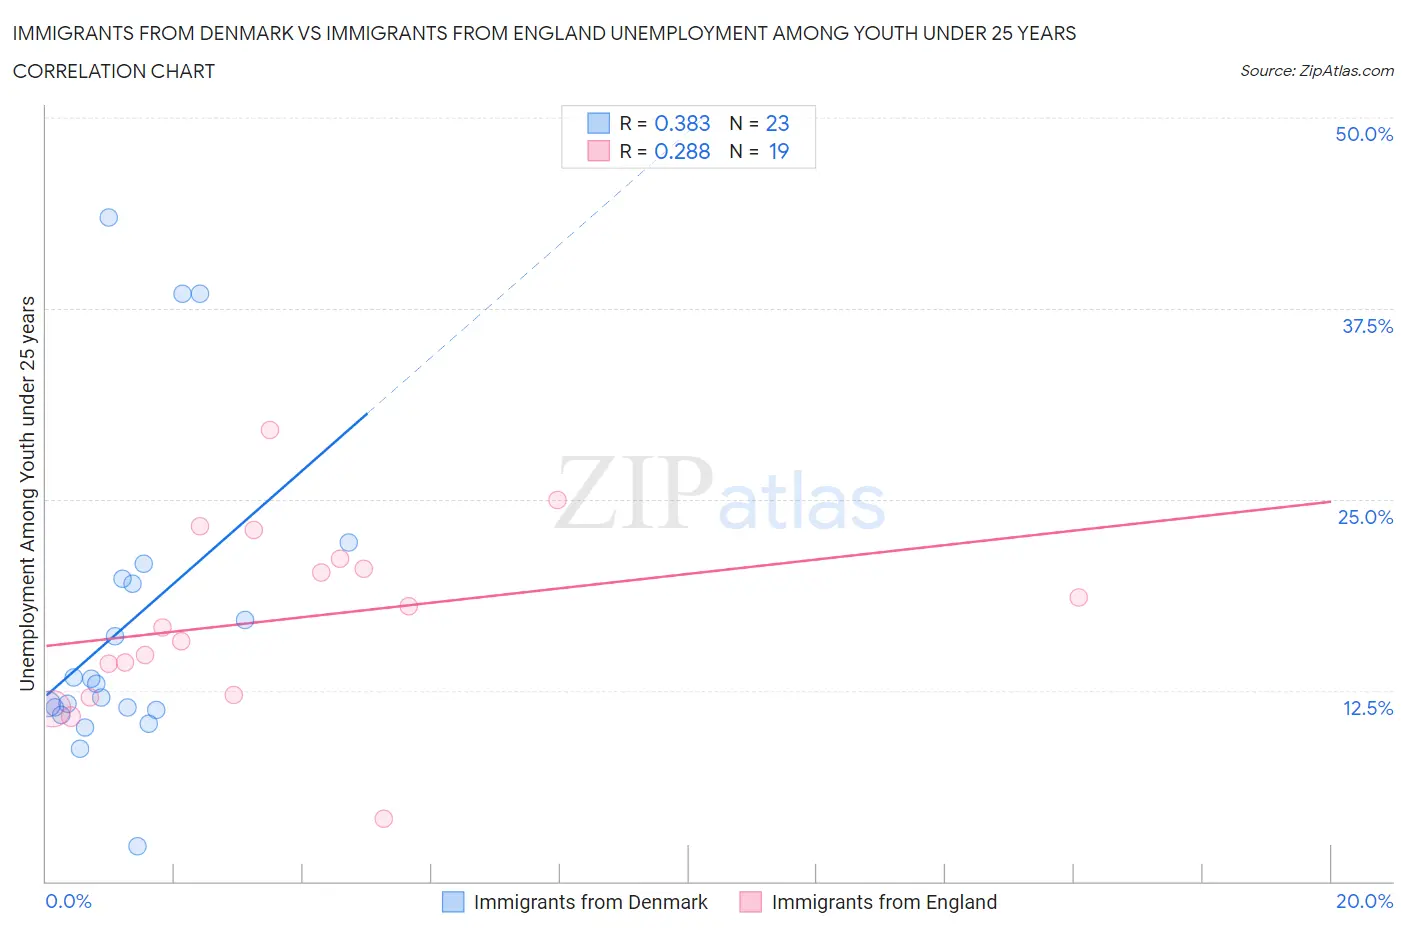
Immigrants from Denmark vs Immigrants from England Unemployment Among Youth under 25 years Correlation Chart
The statistical analysis conducted on geographies consisting of 135,705,555 people shows a mild positive correlation between the proportion of Immigrants from Denmark and unemployment rate among youth under the age of 25 in the United States with a correlation coefficient (R) of 0.383 and weighted average of 11.6%. Similarly, the statistical analysis conducted on geographies consisting of 386,140,742 people shows a weak positive correlation between the proportion of Immigrants from England and unemployment rate among youth under the age of 25 in the United States with a correlation coefficient (R) of 0.288 and weighted average of 11.5%, a difference of 1.5%.
Unemployment Among Youth under 25 years Correlation Summary
| Measurement | Immigrants from Denmark | Immigrants from England |
| Minimum | 2.3% | 4.1% |
| Maximum | 43.5% | 29.5% |
| Range | 41.2% | 25.4% |
| Mean | 16.8% | 17.1% |
| Median | 12.9% | 16.6% |
| Interquartile 25% (IQ1) | 11.2% | 12.2% |
| Interquartile 75% (IQ3) | 19.8% | 21.1% |
| Interquartile Range (IQR) | 8.6% | 8.9% |
| Standard Deviation (Sample) | 10.3% | 6.0% |
| Standard Deviation (Population) | 10.0% | 5.8% |
Similar Demographics by Unemployment Among Youth under 25 years
Demographics Similar to Immigrants from Denmark by Unemployment Among Youth under 25 years
In terms of unemployment among youth under 25 years, the demographic groups most similar to Immigrants from Denmark are Ugandan (11.6%, a difference of 0.030%), Immigrants from Iraq (11.6%, a difference of 0.090%), Immigrants from Europe (11.6%, a difference of 0.11%), Immigrants from Hong Kong (11.6%, a difference of 0.11%), and Immigrants from China (11.6%, a difference of 0.21%).
| Demographics | Rating | Rank | Unemployment Among Youth under 25 years |
| Russians | 57.3 /100 | #170 | Average 11.6% |
| Bangladeshis | 55.6 /100 | #171 | Average 11.6% |
| Immigrants | Morocco | 55.1 /100 | #172 | Average 11.6% |
| Immigrants | South Eastern Asia | 51.7 /100 | #173 | Average 11.6% |
| Immigrants | China | 50.0 /100 | #174 | Average 11.6% |
| Immigrants | Iraq | 47.0 /100 | #175 | Average 11.6% |
| Ugandans | 45.6 /100 | #176 | Average 11.6% |
| Immigrants | Denmark | 45.0 /100 | #177 | Average 11.6% |
| Immigrants | Europe | 42.4 /100 | #178 | Average 11.6% |
| Immigrants | Hong Kong | 42.4 /100 | #179 | Average 11.6% |
| Spaniards | 39.8 /100 | #180 | Fair 11.7% |
| Syrians | 38.4 /100 | #181 | Fair 11.7% |
| Immigrants | Italy | 36.2 /100 | #182 | Fair 11.7% |
| Americans | 34.5 /100 | #183 | Fair 11.7% |
| Immigrants | Eastern Europe | 34.1 /100 | #184 | Fair 11.7% |
Demographics Similar to Immigrants from England by Unemployment Among Youth under 25 years
In terms of unemployment among youth under 25 years, the demographic groups most similar to Immigrants from England are Immigrants from Indonesia (11.5%, a difference of 0.030%), Immigrants from Belgium (11.5%, a difference of 0.030%), Asian (11.4%, a difference of 0.10%), Immigrants from Uruguay (11.5%, a difference of 0.12%), and Romanian (11.4%, a difference of 0.13%).
| Demographics | Rating | Rank | Unemployment Among Youth under 25 years |
| Immigrants | Spain | 84.6 /100 | #131 | Excellent 11.4% |
| Ethiopians | 83.2 /100 | #132 | Excellent 11.4% |
| Lebanese | 83.1 /100 | #133 | Excellent 11.4% |
| Immigrants | Chile | 80.4 /100 | #134 | Excellent 11.4% |
| Immigrants | Oceania | 80.2 /100 | #135 | Excellent 11.4% |
| Romanians | 80.1 /100 | #136 | Excellent 11.4% |
| Asians | 79.7 /100 | #137 | Good 11.4% |
| Immigrants | England | 78.1 /100 | #138 | Good 11.5% |
| Immigrants | Indonesia | 77.6 /100 | #139 | Good 11.5% |
| Immigrants | Belgium | 77.5 /100 | #140 | Good 11.5% |
| Immigrants | Uruguay | 76.1 /100 | #141 | Good 11.5% |
| Immigrants | Korea | 75.1 /100 | #142 | Good 11.5% |
| Immigrants | Uganda | 74.5 /100 | #143 | Good 11.5% |
| Immigrants | Brazil | 74.3 /100 | #144 | Good 11.5% |
| Argentineans | 73.0 /100 | #145 | Good 11.5% |