Immigrants from Denmark vs Immigrants from Ecuador Unemployment Among Women with Children Under 18 years
COMPARE
Immigrants from Denmark
Immigrants from Ecuador
Unemployment Among Women with Children Under 18 years
Unemployment Among Women with Children Under 18 years Comparison
Immigrants from Denmark
Immigrants from Ecuador
5.4%
UNEMPLOYMENT AMONG WOMEN WITH CHILDREN UNDER 18 YEARS
58.0/ 100
METRIC RATING
167th/ 347
METRIC RANK
6.6%
UNEMPLOYMENT AMONG WOMEN WITH CHILDREN UNDER 18 YEARS
0.0/ 100
METRIC RATING
316th/ 347
METRIC RANK
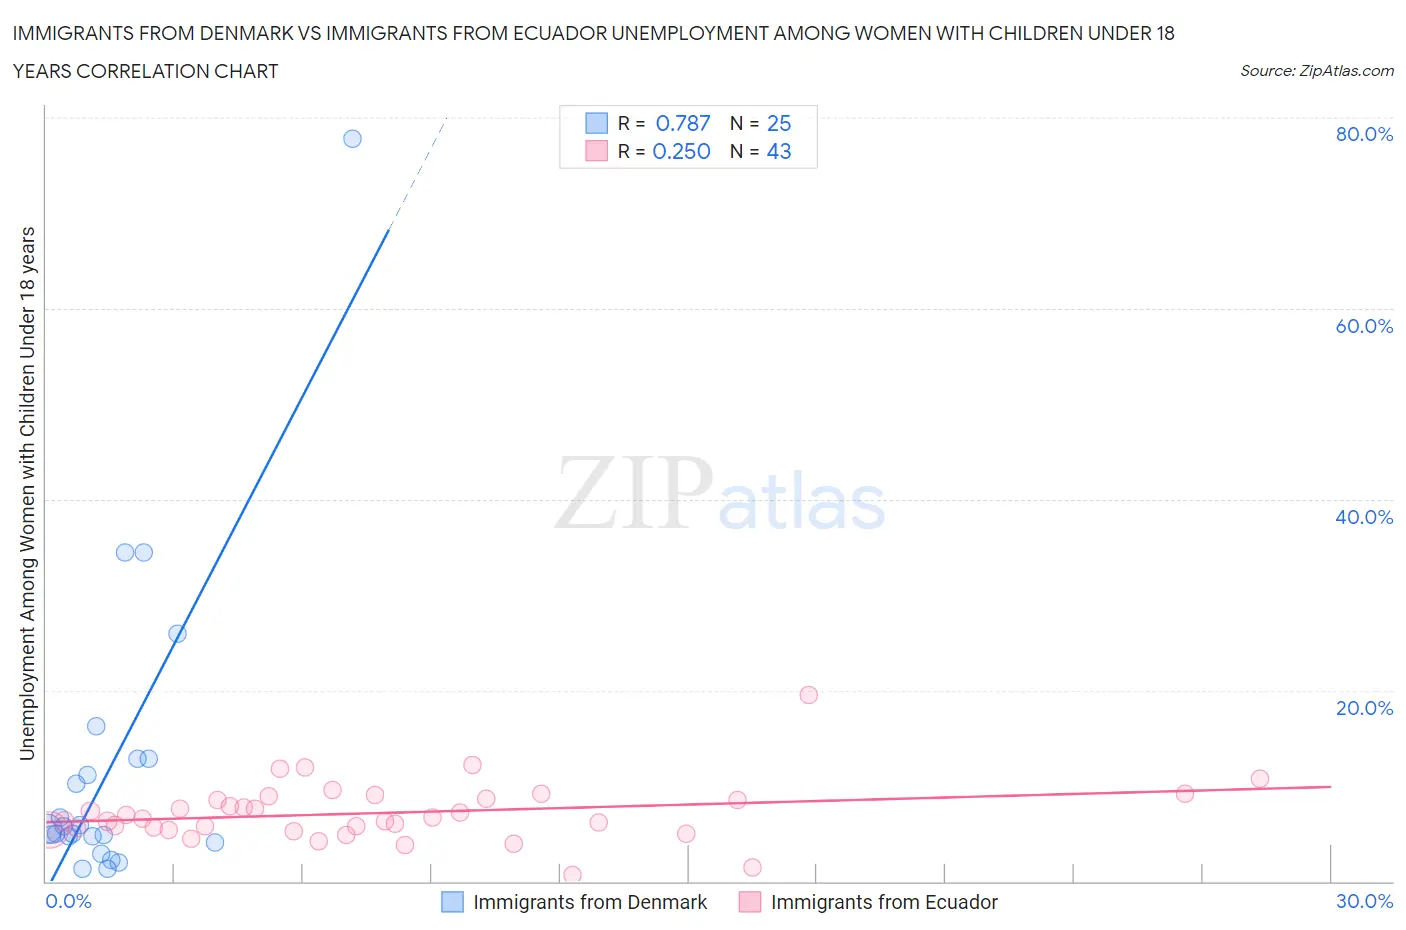
Immigrants from Denmark vs Immigrants from Ecuador Unemployment Among Women with Children Under 18 years Correlation Chart
The statistical analysis conducted on geographies consisting of 133,475,483 people shows a strong positive correlation between the proportion of Immigrants from Denmark and unemployment rate among women with children under the age of 18 in the United States with a correlation coefficient (R) of 0.787 and weighted average of 5.4%. Similarly, the statistical analysis conducted on geographies consisting of 265,110,444 people shows a weak positive correlation between the proportion of Immigrants from Ecuador and unemployment rate among women with children under the age of 18 in the United States with a correlation coefficient (R) of 0.250 and weighted average of 6.6%, a difference of 22.5%.
Unemployment Among Women with Children Under 18 years Correlation Summary
| Measurement | Immigrants from Denmark | Immigrants from Ecuador |
| Minimum | 1.3% | 0.60% |
| Maximum | 77.8% | 19.5% |
| Range | 76.5% | 18.9% |
| Mean | 12.1% | 7.1% |
| Median | 5.5% | 6.6% |
| Interquartile 25% (IQ1) | 4.4% | 5.4% |
| Interquartile 75% (IQ3) | 12.8% | 8.6% |
| Interquartile Range (IQR) | 8.4% | 3.2% |
| Standard Deviation (Sample) | 16.6% | 3.1% |
| Standard Deviation (Population) | 16.2% | 3.1% |
Similar Demographics by Unemployment Among Women with Children Under 18 years
Demographics Similar to Immigrants from Denmark by Unemployment Among Women with Children Under 18 years
In terms of unemployment among women with children under 18 years, the demographic groups most similar to Immigrants from Denmark are Aleut (5.4%, a difference of 0.10%), Immigrants from Northern Africa (5.4%, a difference of 0.14%), Immigrants from Thailand (5.4%, a difference of 0.20%), Samoan (5.4%, a difference of 0.28%), and Tlingit-Haida (5.4%, a difference of 0.29%).
| Demographics | Rating | Rank | Unemployment Among Women with Children Under 18 years |
| Afghans | 66.6 /100 | #160 | Good 5.4% |
| Immigrants | Iraq | 65.9 /100 | #161 | Good 5.4% |
| Immigrants | Saudi Arabia | 65.0 /100 | #162 | Good 5.4% |
| Lebanese | 64.7 /100 | #163 | Good 5.4% |
| Celtics | 63.0 /100 | #164 | Good 5.4% |
| Tlingit-Haida | 61.9 /100 | #165 | Good 5.4% |
| Aleuts | 59.4 /100 | #166 | Average 5.4% |
| Immigrants | Denmark | 58.0 /100 | #167 | Average 5.4% |
| Immigrants | Northern Africa | 56.1 /100 | #168 | Average 5.4% |
| Immigrants | Thailand | 55.3 /100 | #169 | Average 5.4% |
| Samoans | 54.1 /100 | #170 | Average 5.4% |
| Immigrants | Philippines | 53.1 /100 | #171 | Average 5.4% |
| Immigrants | Kazakhstan | 51.7 /100 | #172 | Average 5.4% |
| Immigrants | Eastern Africa | 51.3 /100 | #173 | Average 5.4% |
| Immigrants | Uzbekistan | 50.0 /100 | #174 | Average 5.4% |
Demographics Similar to Immigrants from Ecuador by Unemployment Among Women with Children Under 18 years
In terms of unemployment among women with children under 18 years, the demographic groups most similar to Immigrants from Ecuador are Shoshone (6.6%, a difference of 0.040%), Alaska Native (6.7%, a difference of 0.33%), British West Indian (6.6%, a difference of 0.34%), Immigrants from West Indies (6.6%, a difference of 0.34%), and Hispanic or Latino (6.6%, a difference of 0.48%).
| Demographics | Rating | Rank | Unemployment Among Women with Children Under 18 years |
| Ecuadorians | 0.0 /100 | #309 | Tragic 6.5% |
| Guyanese | 0.0 /100 | #310 | Tragic 6.6% |
| Yaqui | 0.0 /100 | #311 | Tragic 6.6% |
| Immigrants | Mexico | 0.0 /100 | #312 | Tragic 6.6% |
| Hispanics or Latinos | 0.0 /100 | #313 | Tragic 6.6% |
| British West Indians | 0.0 /100 | #314 | Tragic 6.6% |
| Immigrants | West Indies | 0.0 /100 | #315 | Tragic 6.6% |
| Immigrants | Ecuador | 0.0 /100 | #316 | Tragic 6.6% |
| Shoshone | 0.0 /100 | #317 | Tragic 6.6% |
| Alaska Natives | 0.0 /100 | #318 | Tragic 6.7% |
| Central American Indians | 0.0 /100 | #319 | Tragic 6.7% |
| Immigrants | Belize | 0.0 /100 | #320 | Tragic 6.7% |
| U.S. Virgin Islanders | 0.0 /100 | #321 | Tragic 6.7% |
| Houma | 0.0 /100 | #322 | Tragic 6.8% |
| Pueblo | 0.0 /100 | #323 | Tragic 6.8% |