Immigrants from Denmark vs Immigrants from Colombia Unemployment Among Ages 55 to 59 years
COMPARE
Immigrants from Denmark
Immigrants from Colombia
Unemployment Among Ages 55 to 59 years
Unemployment Among Ages 55 to 59 years Comparison
Immigrants from Denmark
Immigrants from Colombia
4.9%
UNEMPLOYMENT AMONG AGES 55 TO 59 YEARS
10.3/ 100
METRIC RATING
214th/ 347
METRIC RANK
4.7%
UNEMPLOYMENT AMONG AGES 55 TO 59 YEARS
96.9/ 100
METRIC RATING
86th/ 347
METRIC RANK
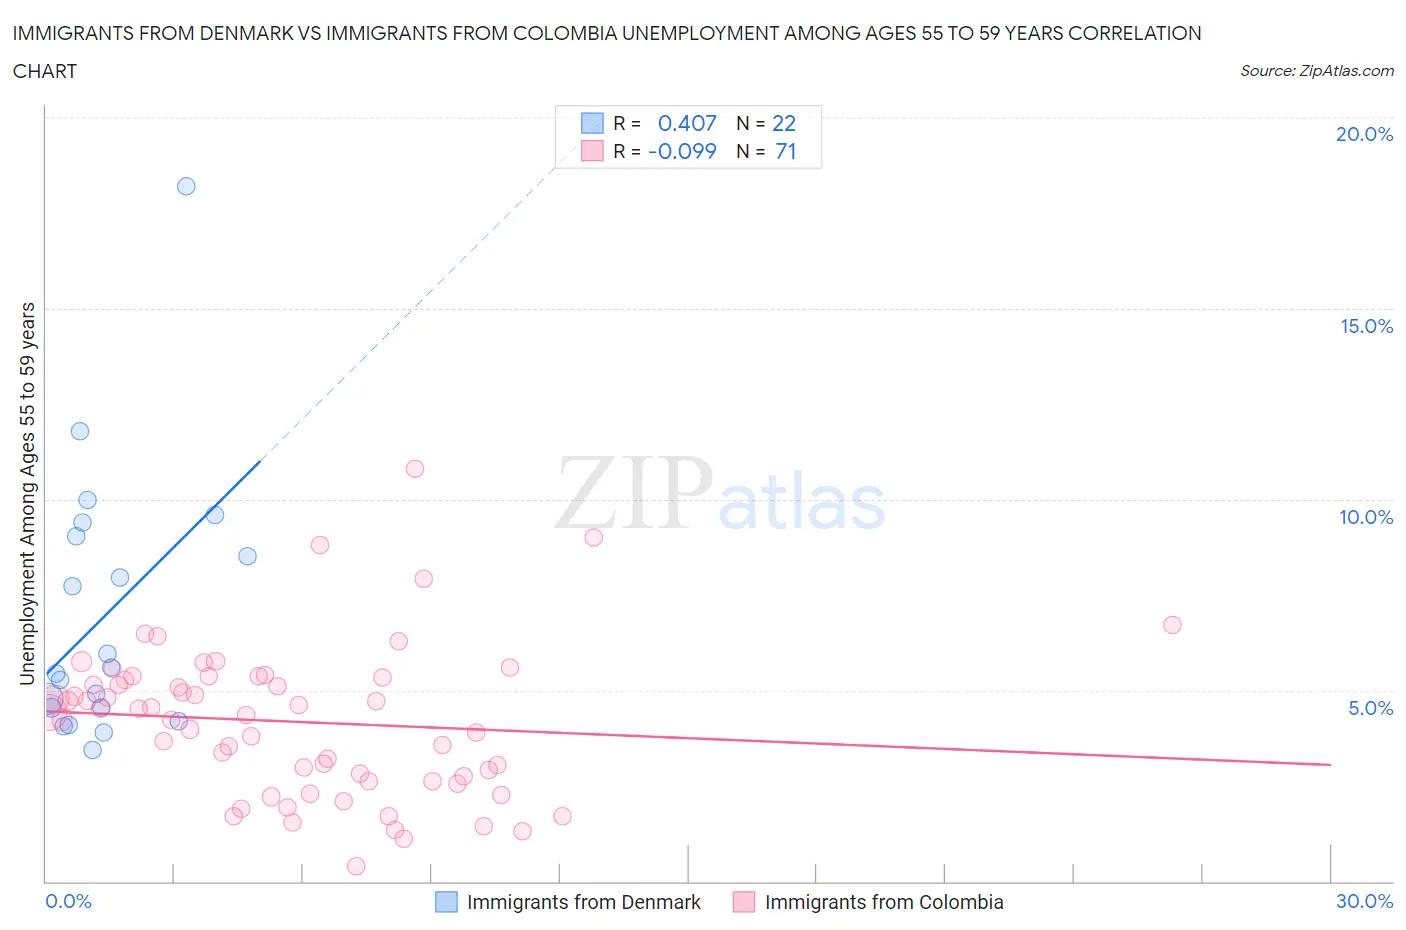
Immigrants from Denmark vs Immigrants from Colombia Unemployment Among Ages 55 to 59 years Correlation Chart
The statistical analysis conducted on geographies consisting of 131,957,916 people shows a moderate positive correlation between the proportion of Immigrants from Denmark and unemployment rate among population between the ages 55 and 59 in the United States with a correlation coefficient (R) of 0.407 and weighted average of 4.9%. Similarly, the statistical analysis conducted on geographies consisting of 355,214,802 people shows a slight negative correlation between the proportion of Immigrants from Colombia and unemployment rate among population between the ages 55 and 59 in the United States with a correlation coefficient (R) of -0.099 and weighted average of 4.7%, a difference of 5.9%.
Unemployment Among Ages 55 to 59 years Correlation Summary
| Measurement | Immigrants from Denmark | Immigrants from Colombia |
| Minimum | 3.4% | 0.40% |
| Maximum | 18.2% | 10.8% |
| Range | 14.8% | 10.4% |
| Mean | 6.9% | 4.2% |
| Median | 5.5% | 4.4% |
| Interquartile 25% (IQ1) | 4.5% | 2.6% |
| Interquartile 75% (IQ3) | 9.0% | 5.3% |
| Interquartile Range (IQR) | 4.5% | 2.7% |
| Standard Deviation (Sample) | 3.5% | 2.0% |
| Standard Deviation (Population) | 3.4% | 1.9% |
Similar Demographics by Unemployment Among Ages 55 to 59 years
Demographics Similar to Immigrants from Denmark by Unemployment Among Ages 55 to 59 years
In terms of unemployment among ages 55 to 59 years, the demographic groups most similar to Immigrants from Denmark are Bermudan (4.9%, a difference of 0.070%), Nonimmigrants (4.9%, a difference of 0.090%), Syrian (4.9%, a difference of 0.20%), Hawaiian (4.9%, a difference of 0.25%), and Creek (4.9%, a difference of 0.26%).
| Demographics | Rating | Rank | Unemployment Among Ages 55 to 59 years |
| Immigrants | Australia | 14.1 /100 | #207 | Poor 4.9% |
| Immigrants | Kazakhstan | 14.0 /100 | #208 | Poor 4.9% |
| Immigrants | Haiti | 13.3 /100 | #209 | Poor 4.9% |
| Creek | 12.9 /100 | #210 | Poor 4.9% |
| Hawaiians | 12.8 /100 | #211 | Poor 4.9% |
| Immigrants | Nonimmigrants | 11.2 /100 | #212 | Poor 4.9% |
| Bermudans | 11.0 /100 | #213 | Poor 4.9% |
| Immigrants | Denmark | 10.3 /100 | #214 | Poor 4.9% |
| Syrians | 8.6 /100 | #215 | Tragic 4.9% |
| Spanish Americans | 8.1 /100 | #216 | Tragic 4.9% |
| Immigrants | Brazil | 8.1 /100 | #217 | Tragic 4.9% |
| Immigrants | Austria | 8.0 /100 | #218 | Tragic 4.9% |
| Immigrants | Nigeria | 8.0 /100 | #219 | Tragic 4.9% |
| Indians (Asian) | 7.6 /100 | #220 | Tragic 4.9% |
| Nigerians | 7.5 /100 | #221 | Tragic 4.9% |
Demographics Similar to Immigrants from Colombia by Unemployment Among Ages 55 to 59 years
In terms of unemployment among ages 55 to 59 years, the demographic groups most similar to Immigrants from Colombia are Malaysian (4.7%, a difference of 0.0%), Immigrants from Vietnam (4.7%, a difference of 0.0%), Polish (4.7%, a difference of 0.020%), Immigrants from Cameroon (4.7%, a difference of 0.020%), and Irish (4.7%, a difference of 0.040%).
| Demographics | Rating | Rank | Unemployment Among Ages 55 to 59 years |
| Sri Lankans | 98.1 /100 | #79 | Exceptional 4.6% |
| Cambodians | 98.0 /100 | #80 | Exceptional 4.6% |
| Taiwanese | 97.9 /100 | #81 | Exceptional 4.6% |
| Latvians | 97.8 /100 | #82 | Exceptional 4.6% |
| Lebanese | 97.5 /100 | #83 | Exceptional 4.6% |
| Malaysians | 96.9 /100 | #84 | Exceptional 4.7% |
| Immigrants | Vietnam | 96.9 /100 | #85 | Exceptional 4.7% |
| Immigrants | Colombia | 96.9 /100 | #86 | Exceptional 4.7% |
| Poles | 96.9 /100 | #87 | Exceptional 4.7% |
| Immigrants | Cameroon | 96.9 /100 | #88 | Exceptional 4.7% |
| Irish | 96.8 /100 | #89 | Exceptional 4.7% |
| Immigrants | Poland | 96.4 /100 | #90 | Exceptional 4.7% |
| New Zealanders | 96.3 /100 | #91 | Exceptional 4.7% |
| Iraqis | 96.1 /100 | #92 | Exceptional 4.7% |
| Immigrants | England | 95.8 /100 | #93 | Exceptional 4.7% |