Immigrants from Czechoslovakia vs Welsh Unemployment Among Ages 25 to 29 years
COMPARE
Immigrants from Czechoslovakia
Welsh
Unemployment Among Ages 25 to 29 years
Unemployment Among Ages 25 to 29 years Comparison
Immigrants from Czechoslovakia
Welsh
6.6%
UNEMPLOYMENT AMONG AGES 25 TO 29 YEARS
60.2/ 100
METRIC RATING
162nd/ 347
METRIC RANK
6.6%
UNEMPLOYMENT AMONG AGES 25 TO 29 YEARS
61.3/ 100
METRIC RATING
159th/ 347
METRIC RANK
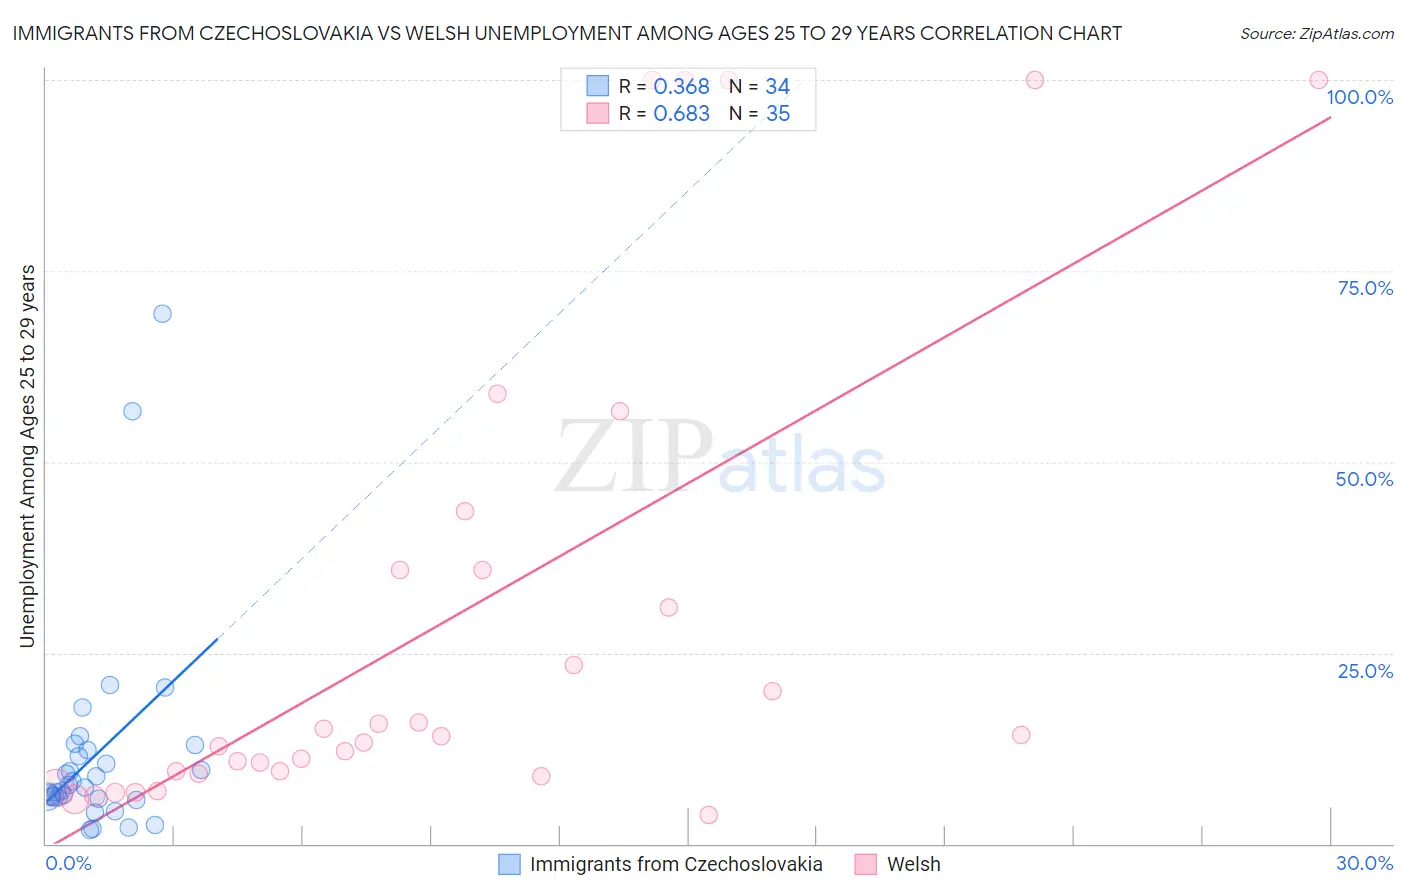
Immigrants from Czechoslovakia vs Welsh Unemployment Among Ages 25 to 29 years Correlation Chart
The statistical analysis conducted on geographies consisting of 189,772,937 people shows a mild positive correlation between the proportion of Immigrants from Czechoslovakia and unemployment rate among population between the ages 25 and 29 in the United States with a correlation coefficient (R) of 0.368 and weighted average of 6.6%. Similarly, the statistical analysis conducted on geographies consisting of 476,418,818 people shows a significant positive correlation between the proportion of Welsh and unemployment rate among population between the ages 25 and 29 in the United States with a correlation coefficient (R) of 0.683 and weighted average of 6.6%, a difference of 0.070%.
Unemployment Among Ages 25 to 29 years Correlation Summary
| Measurement | Immigrants from Czechoslovakia | Welsh |
| Minimum | 1.8% | 3.8% |
| Maximum | 69.4% | 100.0% |
| Range | 67.5% | 96.2% |
| Mean | 11.8% | 29.5% |
| Median | 7.5% | 14.1% |
| Interquartile 25% (IQ1) | 6.1% | 9.2% |
| Interquartile 75% (IQ3) | 12.3% | 35.8% |
| Interquartile Range (IQR) | 6.1% | 26.6% |
| Standard Deviation (Sample) | 13.9% | 32.2% |
| Standard Deviation (Population) | 13.7% | 31.7% |
Demographics Similar to Immigrants from Czechoslovakia and Welsh by Unemployment Among Ages 25 to 29 years
In terms of unemployment among ages 25 to 29 years, the demographic groups most similar to Immigrants from Czechoslovakia are Paraguayan (6.6%, a difference of 0.020%), Scottish (6.6%, a difference of 0.040%), Immigrants from Middle Africa (6.6%, a difference of 0.050%), Immigrants from Russia (6.6%, a difference of 0.090%), and Greek (6.6%, a difference of 0.11%). Similarly, the demographic groups most similar to Welsh are Immigrants from Russia (6.6%, a difference of 0.010%), Scottish (6.6%, a difference of 0.040%), Paraguayan (6.6%, a difference of 0.060%), Immigrants from Middle Africa (6.6%, a difference of 0.12%), and Immigrants from Laos (6.6%, a difference of 0.15%).
| Demographics | Rating | Rank | Unemployment Among Ages 25 to 29 years |
| Finns | 66.9 /100 | #150 | Good 6.6% |
| Ukrainians | 65.5 /100 | #151 | Good 6.6% |
| Samoans | 64.6 /100 | #152 | Good 6.6% |
| Immigrants | Italy | 64.4 /100 | #153 | Good 6.6% |
| Colombians | 64.0 /100 | #154 | Good 6.6% |
| Immigrants | Latvia | 63.9 /100 | #155 | Good 6.6% |
| Immigrants | Laos | 63.5 /100 | #156 | Good 6.6% |
| South Africans | 63.5 /100 | #157 | Good 6.6% |
| Immigrants | Russia | 61.5 /100 | #158 | Good 6.6% |
| Welsh | 61.3 /100 | #159 | Good 6.6% |
| Scottish | 60.7 /100 | #160 | Good 6.6% |
| Paraguayans | 60.4 /100 | #161 | Good 6.6% |
| Immigrants | Czechoslovakia | 60.2 /100 | #162 | Good 6.6% |
| Immigrants | Middle Africa | 59.4 /100 | #163 | Average 6.6% |
| Greeks | 58.5 /100 | #164 | Average 6.6% |
| English | 58.0 /100 | #165 | Average 6.6% |
| Immigrants | Northern Europe | 57.3 /100 | #166 | Average 6.6% |
| Immigrants | Canada | 55.0 /100 | #167 | Average 6.6% |
| Estonians | 54.8 /100 | #168 | Average 6.6% |
| South Americans | 54.5 /100 | #169 | Average 6.6% |
| Albanians | 53.5 /100 | #170 | Average 6.6% |