Immigrants from Czechoslovakia vs Immigrants from Indonesia Unemployment Among Ages 30 to 34 years
COMPARE
Immigrants from Czechoslovakia
Immigrants from Indonesia
Unemployment Among Ages 30 to 34 years
Unemployment Among Ages 30 to 34 years Comparison
Immigrants from Czechoslovakia
Immigrants from Indonesia
5.3%
UNEMPLOYMENT AMONG AGES 30 TO 34 YEARS
89.5/ 100
METRIC RATING
100th/ 347
METRIC RANK
5.2%
UNEMPLOYMENT AMONG AGES 30 TO 34 YEARS
94.7/ 100
METRIC RATING
80th/ 347
METRIC RANK
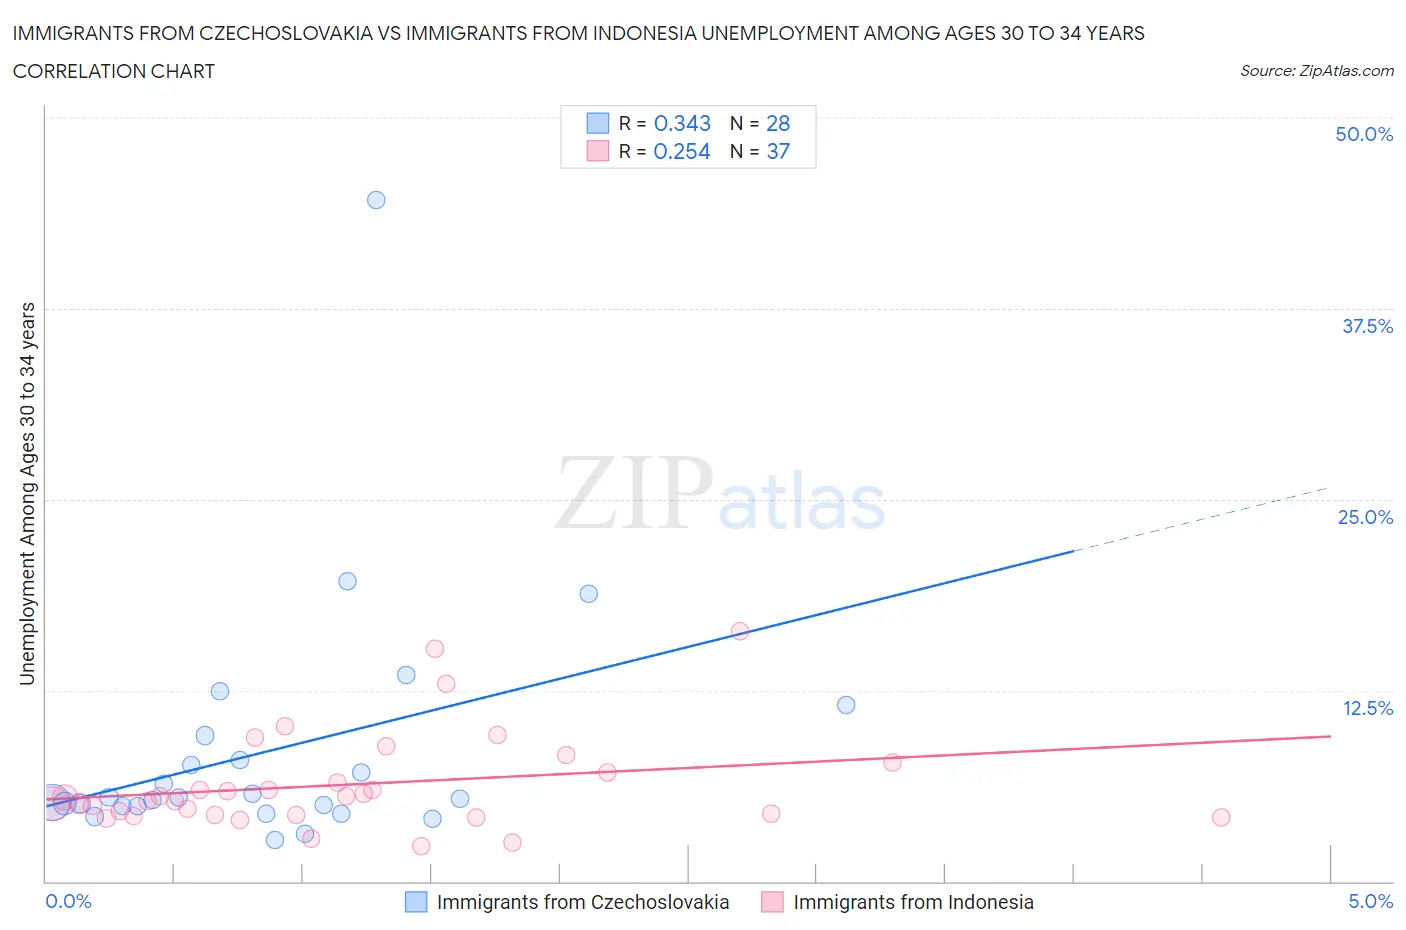
Immigrants from Czechoslovakia vs Immigrants from Indonesia Unemployment Among Ages 30 to 34 years Correlation Chart
The statistical analysis conducted on geographies consisting of 189,322,017 people shows a mild positive correlation between the proportion of Immigrants from Czechoslovakia and unemployment rate among population between the ages 30 and 34 in the United States with a correlation coefficient (R) of 0.343 and weighted average of 5.3%. Similarly, the statistical analysis conducted on geographies consisting of 210,317,048 people shows a weak positive correlation between the proportion of Immigrants from Indonesia and unemployment rate among population between the ages 30 and 34 in the United States with a correlation coefficient (R) of 0.254 and weighted average of 5.2%, a difference of 1.3%.
Unemployment Among Ages 30 to 34 years Correlation Summary
| Measurement | Immigrants from Czechoslovakia | Immigrants from Indonesia |
| Minimum | 2.7% | 2.3% |
| Maximum | 44.6% | 16.4% |
| Range | 41.9% | 14.1% |
| Mean | 8.6% | 6.3% |
| Median | 5.4% | 5.5% |
| Interquartile 25% (IQ1) | 4.9% | 4.3% |
| Interquartile 75% (IQ3) | 8.7% | 7.4% |
| Interquartile Range (IQR) | 3.8% | 3.1% |
| Standard Deviation (Sample) | 8.3% | 3.2% |
| Standard Deviation (Population) | 8.1% | 3.1% |
Demographics Similar to Immigrants from Czechoslovakia and Immigrants from Indonesia by Unemployment Among Ages 30 to 34 years
In terms of unemployment among ages 30 to 34 years, the demographic groups most similar to Immigrants from Czechoslovakia are Immigrants from Ireland (5.2%, a difference of 0.21%), Immigrants from North Macedonia (5.2%, a difference of 0.27%), European (5.2%, a difference of 0.45%), Mongolian (5.2%, a difference of 0.46%), and Kenyan (5.2%, a difference of 0.55%). Similarly, the demographic groups most similar to Immigrants from Indonesia are Chilean (5.2%, a difference of 0.10%), Immigrants from Latvia (5.2%, a difference of 0.18%), Immigrants from Korea (5.2%, a difference of 0.21%), Immigrants from Uganda (5.2%, a difference of 0.26%), and Immigrants from Egypt (5.2%, a difference of 0.29%).
| Demographics | Rating | Rank | Unemployment Among Ages 30 to 34 years |
| Immigrants | Indonesia | 94.7 /100 | #80 | Exceptional 5.2% |
| Chileans | 94.4 /100 | #81 | Exceptional 5.2% |
| Immigrants | Latvia | 94.2 /100 | #82 | Exceptional 5.2% |
| Immigrants | Korea | 94.1 /100 | #83 | Exceptional 5.2% |
| Immigrants | Uganda | 94.0 /100 | #84 | Exceptional 5.2% |
| Immigrants | Egypt | 93.9 /100 | #85 | Exceptional 5.2% |
| Immigrants | Australia | 93.5 /100 | #86 | Exceptional 5.2% |
| Bhutanese | 93.5 /100 | #87 | Exceptional 5.2% |
| Immigrants | Kenya | 93.3 /100 | #88 | Exceptional 5.2% |
| Immigrants | Sweden | 93.3 /100 | #89 | Exceptional 5.2% |
| Immigrants | Romania | 92.8 /100 | #90 | Exceptional 5.2% |
| Iraqis | 92.6 /100 | #91 | Exceptional 5.2% |
| Immigrants | Argentina | 92.5 /100 | #92 | Exceptional 5.2% |
| Laotians | 92.4 /100 | #93 | Exceptional 5.2% |
| Maltese | 92.3 /100 | #94 | Exceptional 5.2% |
| Kenyans | 92.1 /100 | #95 | Exceptional 5.2% |
| Mongolians | 91.7 /100 | #96 | Exceptional 5.2% |
| Europeans | 91.7 /100 | #97 | Exceptional 5.2% |
| Immigrants | North Macedonia | 90.9 /100 | #98 | Exceptional 5.2% |
| Immigrants | Ireland | 90.6 /100 | #99 | Exceptional 5.2% |
| Immigrants | Czechoslovakia | 89.5 /100 | #100 | Excellent 5.3% |