Immigrants from Czechoslovakia vs Immigrants from Cameroon Unemployment Among Ages 16 to 19 years
COMPARE
Immigrants from Czechoslovakia
Immigrants from Cameroon
Unemployment Among Ages 16 to 19 years
Unemployment Among Ages 16 to 19 years Comparison
Immigrants from Czechoslovakia
Immigrants from Cameroon
17.8%
UNEMPLOYMENT AMONG AGES 16 TO 19 YEARS
29.8/ 100
METRIC RATING
197th/ 347
METRIC RANK
18.8%
UNEMPLOYMENT AMONG AGES 16 TO 19 YEARS
0.3/ 100
METRIC RATING
255th/ 347
METRIC RANK
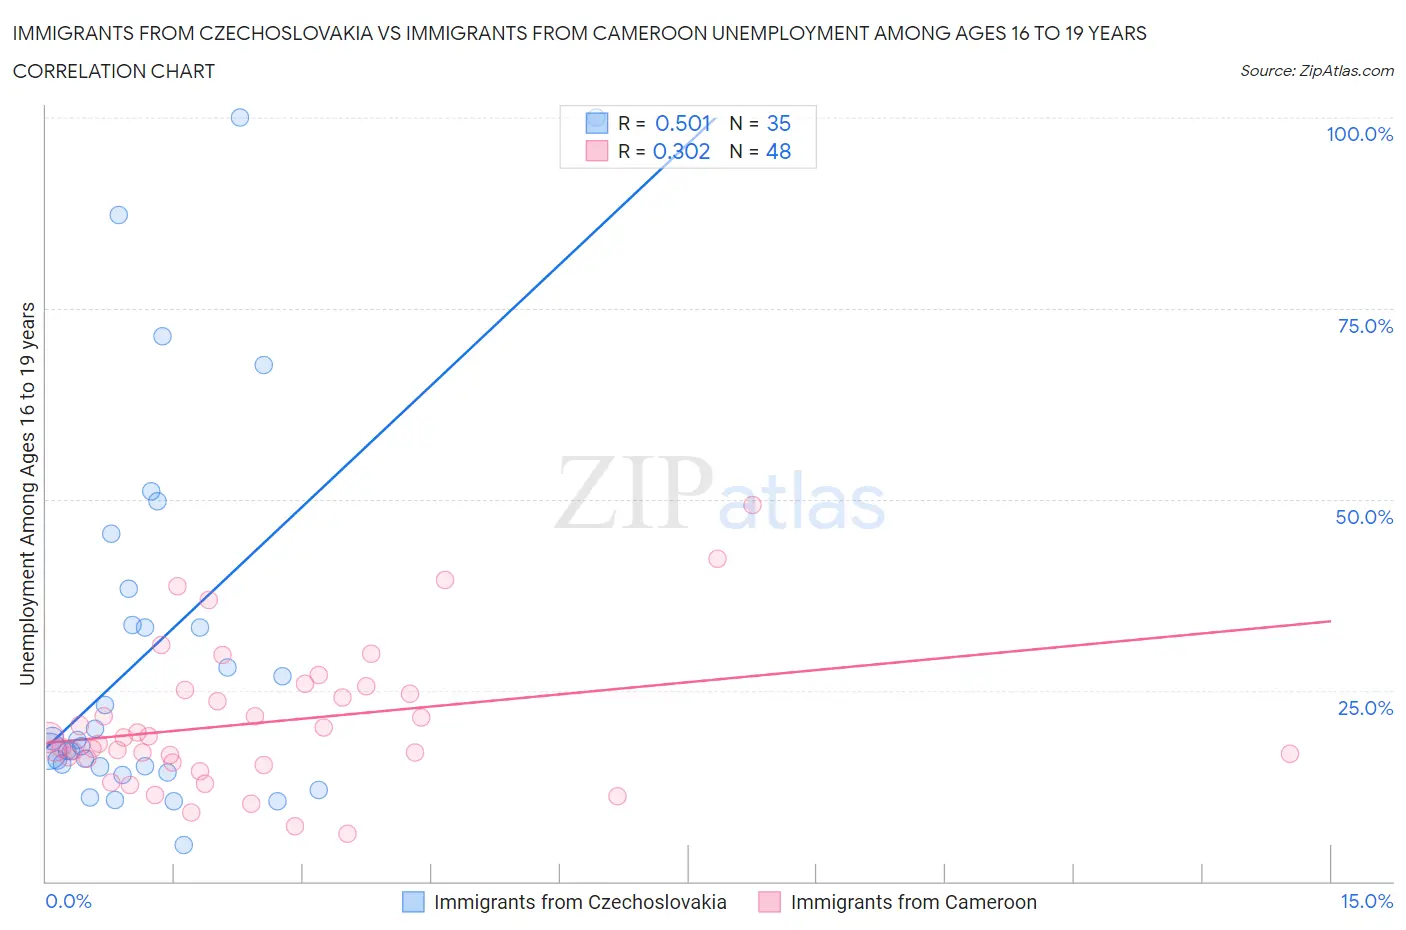
Immigrants from Czechoslovakia vs Immigrants from Cameroon Unemployment Among Ages 16 to 19 years Correlation Chart
The statistical analysis conducted on geographies consisting of 188,832,177 people shows a substantial positive correlation between the proportion of Immigrants from Czechoslovakia and unemployment rate among population between the ages 16 and 19 in the United States with a correlation coefficient (R) of 0.501 and weighted average of 17.8%. Similarly, the statistical analysis conducted on geographies consisting of 128,803,967 people shows a mild positive correlation between the proportion of Immigrants from Cameroon and unemployment rate among population between the ages 16 and 19 in the United States with a correlation coefficient (R) of 0.302 and weighted average of 18.8%, a difference of 5.9%.
Unemployment Among Ages 16 to 19 years Correlation Summary
| Measurement | Immigrants from Czechoslovakia | Immigrants from Cameroon |
| Minimum | 4.8% | 6.2% |
| Maximum | 100.0% | 49.3% |
| Range | 95.2% | 43.1% |
| Mean | 30.8% | 20.7% |
| Median | 18.5% | 18.4% |
| Interquartile 25% (IQ1) | 15.0% | 15.8% |
| Interquartile 75% (IQ3) | 38.3% | 24.8% |
| Interquartile Range (IQR) | 23.3% | 9.0% |
| Standard Deviation (Sample) | 25.7% | 9.1% |
| Standard Deviation (Population) | 25.3% | 9.0% |
Similar Demographics by Unemployment Among Ages 16 to 19 years
Demographics Similar to Immigrants from Czechoslovakia by Unemployment Among Ages 16 to 19 years
In terms of unemployment among ages 16 to 19 years, the demographic groups most similar to Immigrants from Czechoslovakia are Ethiopian (17.8%, a difference of 0.010%), Immigrants from Ireland (17.8%, a difference of 0.070%), Immigrants from Fiji (17.8%, a difference of 0.12%), Immigrants from Ethiopia (17.8%, a difference of 0.14%), and Immigrants from Portugal (17.8%, a difference of 0.15%).
| Demographics | Rating | Rank | Unemployment Among Ages 16 to 19 years |
| Marshallese | 41.7 /100 | #190 | Average 17.6% |
| Immigrants | Costa Rica | 41.3 /100 | #191 | Average 17.6% |
| Immigrants | Philippines | 40.7 /100 | #192 | Average 17.7% |
| Immigrants | Australia | 40.6 /100 | #193 | Average 17.7% |
| Peruvians | 38.8 /100 | #194 | Fair 17.7% |
| Immigrants | Peru | 37.3 /100 | #195 | Fair 17.7% |
| Alaskan Athabascans | 34.1 /100 | #196 | Fair 17.7% |
| Immigrants | Czechoslovakia | 29.8 /100 | #197 | Fair 17.8% |
| Ethiopians | 29.6 /100 | #198 | Fair 17.8% |
| Immigrants | Ireland | 28.5 /100 | #199 | Fair 17.8% |
| Immigrants | Fiji | 27.7 /100 | #200 | Fair 17.8% |
| Immigrants | Ethiopia | 27.4 /100 | #201 | Fair 17.8% |
| Immigrants | Portugal | 27.2 /100 | #202 | Fair 17.8% |
| Immigrants | Eastern Europe | 23.6 /100 | #203 | Fair 17.8% |
| Immigrants | Nonimmigrants | 20.9 /100 | #204 | Fair 17.9% |
Demographics Similar to Immigrants from Cameroon by Unemployment Among Ages 16 to 19 years
In terms of unemployment among ages 16 to 19 years, the demographic groups most similar to Immigrants from Cameroon are Apache (18.8%, a difference of 0.010%), Central American (18.8%, a difference of 0.040%), Mexican American Indian (18.8%, a difference of 0.070%), Immigrants from Nigeria (18.9%, a difference of 0.33%), and Immigrants from Guatemala (18.7%, a difference of 0.34%).
| Demographics | Rating | Rank | Unemployment Among Ages 16 to 19 years |
| Delaware | 0.5 /100 | #248 | Tragic 18.7% |
| Puget Sound Salish | 0.5 /100 | #249 | Tragic 18.7% |
| Panamanians | 0.4 /100 | #250 | Tragic 18.7% |
| Sub-Saharan Africans | 0.4 /100 | #251 | Tragic 18.7% |
| Immigrants | Guatemala | 0.4 /100 | #252 | Tragic 18.7% |
| Central Americans | 0.3 /100 | #253 | Tragic 18.8% |
| Apache | 0.3 /100 | #254 | Tragic 18.8% |
| Immigrants | Cameroon | 0.3 /100 | #255 | Tragic 18.8% |
| Mexican American Indians | 0.3 /100 | #256 | Tragic 18.8% |
| Immigrants | Nigeria | 0.2 /100 | #257 | Tragic 18.9% |
| Immigrants | Mexico | 0.2 /100 | #258 | Tragic 18.9% |
| Immigrants | Central America | 0.2 /100 | #259 | Tragic 18.9% |
| Nigerians | 0.2 /100 | #260 | Tragic 18.9% |
| Spanish American Indians | 0.1 /100 | #261 | Tragic 18.9% |
| Salvadorans | 0.1 /100 | #262 | Tragic 18.9% |