Immigrants from Cuba vs Immigrants from Western Africa Unemployment Among Ages 20 to 24 years
COMPARE
Immigrants from Cuba
Immigrants from Western Africa
Unemployment Among Ages 20 to 24 years
Unemployment Among Ages 20 to 24 years Comparison
Immigrants from Cuba
Immigrants from Western Africa
8.7%
UNEMPLOYMENT AMONG AGES 20 TO 24 YEARS
100.0/ 100
METRIC RATING
1st/ 347
METRIC RANK
11.7%
UNEMPLOYMENT AMONG AGES 20 TO 24 YEARS
0.0/ 100
METRIC RATING
284th/ 347
METRIC RANK
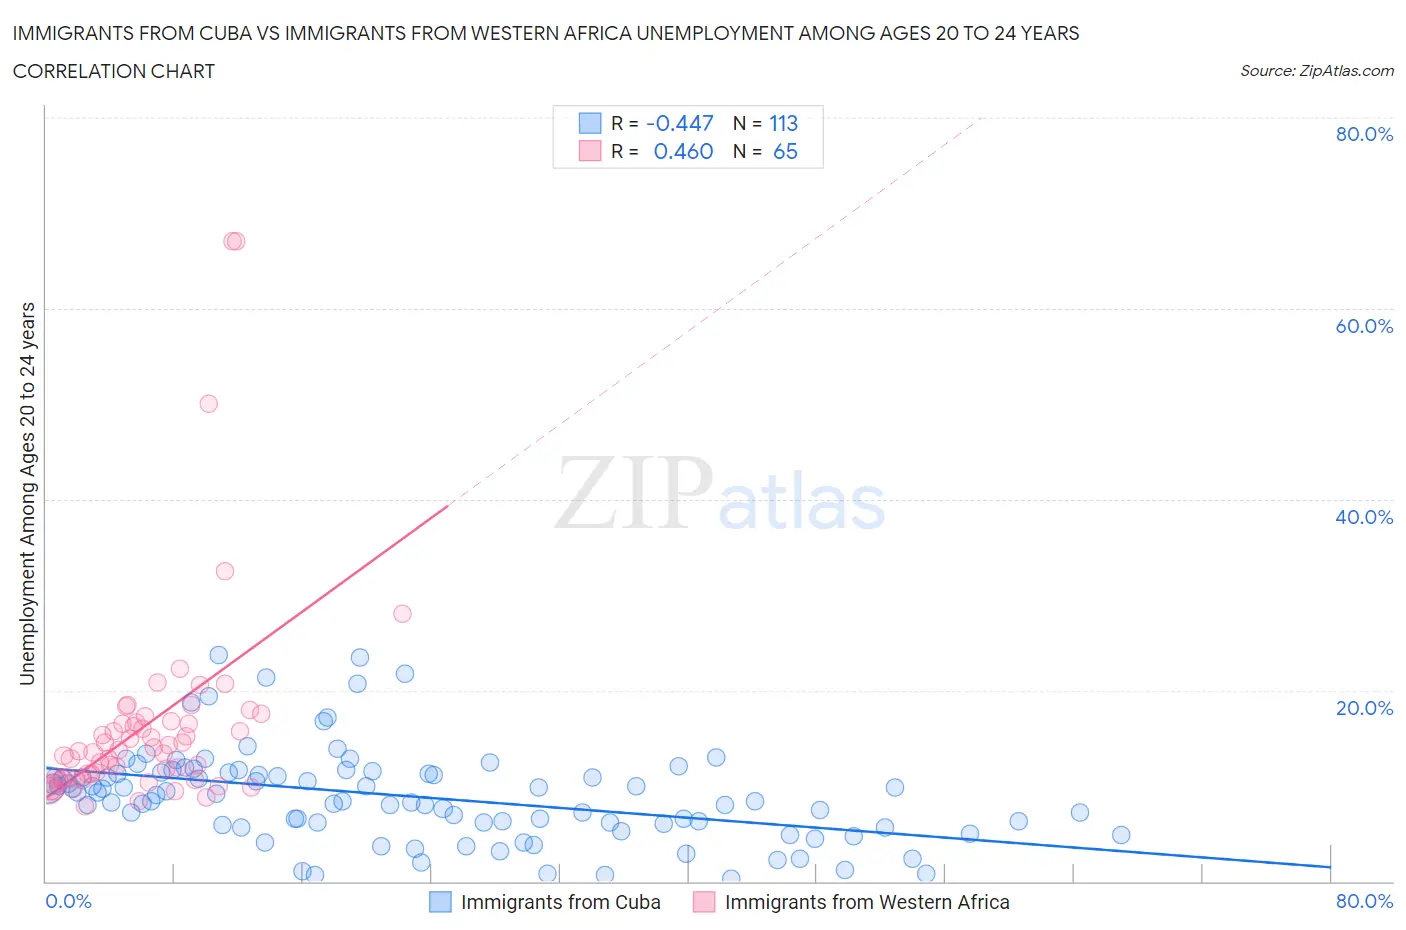
Immigrants from Cuba vs Immigrants from Western Africa Unemployment Among Ages 20 to 24 years Correlation Chart
The statistical analysis conducted on geographies consisting of 318,208,007 people shows a moderate negative correlation between the proportion of Immigrants from Cuba and unemployment rate among population between the ages 20 and 24 in the United States with a correlation coefficient (R) of -0.447 and weighted average of 8.7%. Similarly, the statistical analysis conducted on geographies consisting of 350,498,787 people shows a moderate positive correlation between the proportion of Immigrants from Western Africa and unemployment rate among population between the ages 20 and 24 in the United States with a correlation coefficient (R) of 0.460 and weighted average of 11.7%, a difference of 35.6%.
Unemployment Among Ages 20 to 24 years Correlation Summary
| Measurement | Immigrants from Cuba | Immigrants from Western Africa |
| Minimum | 0.20% | 7.9% |
| Maximum | 23.8% | 67.1% |
| Range | 23.6% | 59.2% |
| Mean | 8.9% | 16.3% |
| Median | 9.1% | 13.6% |
| Interquartile 25% (IQ1) | 6.0% | 10.8% |
| Interquartile 75% (IQ3) | 11.3% | 16.7% |
| Interquartile Range (IQR) | 5.3% | 5.9% |
| Standard Deviation (Sample) | 4.8% | 11.1% |
| Standard Deviation (Population) | 4.8% | 11.0% |
Similar Demographics by Unemployment Among Ages 20 to 24 years
Demographics Similar to Immigrants from Cuba by Unemployment Among Ages 20 to 24 years
In terms of unemployment among ages 20 to 24 years, the demographic groups most similar to Immigrants from Cuba are Immigrants from Venezuela (8.9%, a difference of 2.8%), Indonesian (9.0%, a difference of 3.9%), Venezuelan (9.0%, a difference of 4.1%), Norwegian (9.0%, a difference of 4.3%), and Immigrants from Burma/Myanmar (9.1%, a difference of 5.0%).
| Demographics | Rating | Rank | Unemployment Among Ages 20 to 24 years |
| Immigrants | Cuba | 100.0 /100 | #1 | Exceptional 8.7% |
| Immigrants | Venezuela | 100.0 /100 | #2 | Exceptional 8.9% |
| Indonesians | 100.0 /100 | #3 | Exceptional 9.0% |
| Venezuelans | 100.0 /100 | #4 | Exceptional 9.0% |
| Norwegians | 100.0 /100 | #5 | Exceptional 9.0% |
| Immigrants | Burma/Myanmar | 100.0 /100 | #6 | Exceptional 9.1% |
| Luxembourgers | 100.0 /100 | #7 | Exceptional 9.1% |
| Somalis | 100.0 /100 | #8 | Exceptional 9.1% |
| Immigrants | Somalia | 100.0 /100 | #9 | Exceptional 9.2% |
| Sudanese | 100.0 /100 | #10 | Exceptional 9.2% |
| Zimbabweans | 100.0 /100 | #11 | Exceptional 9.2% |
| Cubans | 100.0 /100 | #12 | Exceptional 9.2% |
| Immigrants | Congo | 100.0 /100 | #13 | Exceptional 9.2% |
| Slovenes | 100.0 /100 | #14 | Exceptional 9.3% |
| Immigrants | Sudan | 100.0 /100 | #15 | Exceptional 9.3% |
Demographics Similar to Immigrants from Western Africa by Unemployment Among Ages 20 to 24 years
In terms of unemployment among ages 20 to 24 years, the demographic groups most similar to Immigrants from Western Africa are Ghanaian (11.7%, a difference of 0.010%), Soviet Union (11.7%, a difference of 0.040%), Ecuadorian (11.8%, a difference of 0.16%), Immigrants from Ecuador (11.8%, a difference of 0.25%), and U.S. Virgin Islander (11.8%, a difference of 0.30%).
| Demographics | Rating | Rank | Unemployment Among Ages 20 to 24 years |
| Africans | 0.0 /100 | #277 | Tragic 11.5% |
| Colville | 0.0 /100 | #278 | Tragic 11.6% |
| Bahamians | 0.0 /100 | #279 | Tragic 11.6% |
| Alaskan Athabascans | 0.0 /100 | #280 | Tragic 11.6% |
| Armenians | 0.0 /100 | #281 | Tragic 11.7% |
| Immigrants | Cameroon | 0.0 /100 | #282 | Tragic 11.7% |
| Ghanaians | 0.0 /100 | #283 | Tragic 11.7% |
| Immigrants | Western Africa | 0.0 /100 | #284 | Tragic 11.7% |
| Soviet Union | 0.0 /100 | #285 | Tragic 11.7% |
| Ecuadorians | 0.0 /100 | #286 | Tragic 11.8% |
| Immigrants | Ecuador | 0.0 /100 | #287 | Tragic 11.8% |
| U.S. Virgin Islanders | 0.0 /100 | #288 | Tragic 11.8% |
| Belizeans | 0.0 /100 | #289 | Tragic 11.8% |
| Immigrants | Caribbean | 0.0 /100 | #290 | Tragic 11.8% |
| Central American Indians | 0.0 /100 | #291 | Tragic 11.9% |