Immigrants from Costa Rica vs Hopi Unemployment Among Seniors over 75 years
COMPARE
Immigrants from Costa Rica
Hopi
Unemployment Among Seniors over 75 years
Unemployment Among Seniors over 75 years Comparison
Immigrants from Costa Rica
Hopi
8.5%
UNEMPLOYMENT AMONG SENIORS OVER 75 YEARS
86.8/ 100
METRIC RATING
143rd/ 347
METRIC RANK
6.3%
UNEMPLOYMENT AMONG SENIORS OVER 75 YEARS
100.0/ 100
METRIC RATING
5th/ 347
METRIC RANK
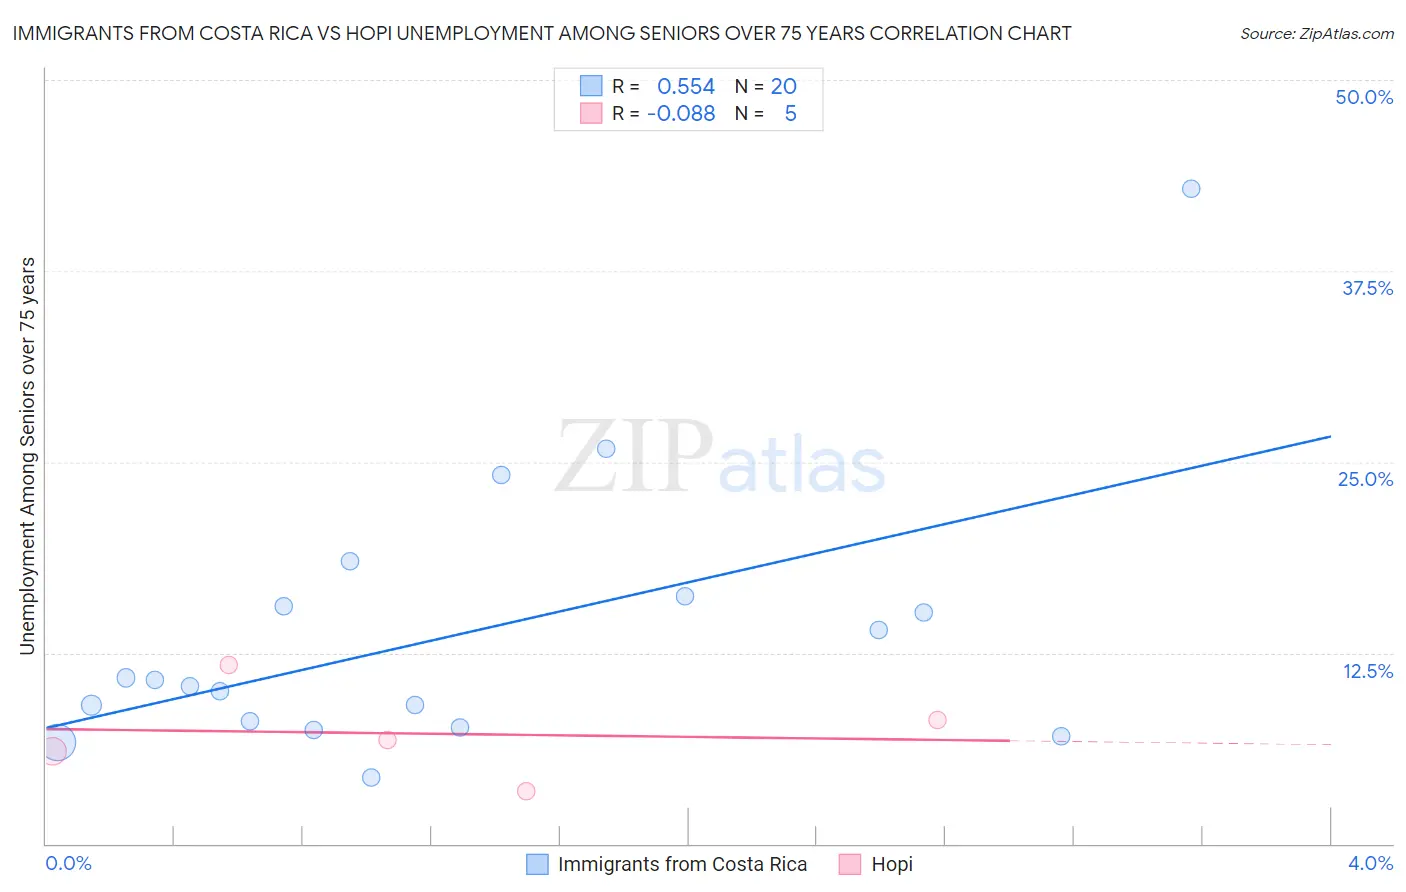
Immigrants from Costa Rica vs Hopi Unemployment Among Seniors over 75 years Correlation Chart
The statistical analysis conducted on geographies consisting of 131,741,976 people shows a substantial positive correlation between the proportion of Immigrants from Costa Rica and unemployment rate among seniors over the age of 75 in the United States with a correlation coefficient (R) of 0.554 and weighted average of 8.5%. Similarly, the statistical analysis conducted on geographies consisting of 59,930,816 people shows a slight negative correlation between the proportion of Hopi and unemployment rate among seniors over the age of 75 in the United States with a correlation coefficient (R) of -0.088 and weighted average of 6.3%, a difference of 35.9%.
Unemployment Among Seniors over 75 years Correlation Summary
| Measurement | Immigrants from Costa Rica | Hopi |
| Minimum | 4.3% | 3.4% |
| Maximum | 42.9% | 11.7% |
| Range | 38.6% | 8.3% |
| Mean | 13.7% | 7.2% |
| Median | 10.5% | 6.8% |
| Interquartile 25% (IQ1) | 7.8% | 4.7% |
| Interquartile 75% (IQ3) | 15.9% | 9.9% |
| Interquartile Range (IQR) | 8.1% | 5.2% |
| Standard Deviation (Sample) | 8.9% | 3.0% |
| Standard Deviation (Population) | 8.7% | 2.7% |
Similar Demographics by Unemployment Among Seniors over 75 years
Demographics Similar to Immigrants from Costa Rica by Unemployment Among Seniors over 75 years
In terms of unemployment among seniors over 75 years, the demographic groups most similar to Immigrants from Costa Rica are Colombian (8.5%, a difference of 0.010%), Immigrants from Ukraine (8.5%, a difference of 0.030%), Immigrants from Romania (8.5%, a difference of 0.070%), Immigrants from South Eastern Asia (8.5%, a difference of 0.12%), and South American (8.5%, a difference of 0.14%).
| Demographics | Rating | Rank | Unemployment Among Seniors over 75 years |
| Immigrants | Trinidad and Tobago | 90.8 /100 | #136 | Exceptional 8.5% |
| Immigrants | Kuwait | 90.5 /100 | #137 | Exceptional 8.5% |
| Immigrants | Bulgaria | 89.6 /100 | #138 | Excellent 8.5% |
| Barbadians | 88.6 /100 | #139 | Excellent 8.5% |
| South Americans | 87.9 /100 | #140 | Excellent 8.5% |
| Immigrants | Bolivia | 87.9 /100 | #141 | Excellent 8.5% |
| Immigrants | Ukraine | 87.0 /100 | #142 | Excellent 8.5% |
| Immigrants | Costa Rica | 86.8 /100 | #143 | Excellent 8.5% |
| Colombians | 86.7 /100 | #144 | Excellent 8.5% |
| Immigrants | Romania | 86.2 /100 | #145 | Excellent 8.5% |
| Immigrants | South Eastern Asia | 85.8 /100 | #146 | Excellent 8.5% |
| Immigrants | Sierra Leone | 85.6 /100 | #147 | Excellent 8.5% |
| Immigrants | Colombia | 85.6 /100 | #148 | Excellent 8.5% |
| Immigrants | Ecuador | 84.6 /100 | #149 | Excellent 8.5% |
| Paiute | 82.5 /100 | #150 | Excellent 8.6% |
Demographics Similar to Hopi by Unemployment Among Seniors over 75 years
In terms of unemployment among seniors over 75 years, the demographic groups most similar to Hopi are Alsatian (6.1%, a difference of 2.6%), Immigrants from Armenia (6.5%, a difference of 3.8%), Spanish American Indian (6.5%, a difference of 4.2%), Taiwanese (6.6%, a difference of 4.6%), and Cheyenne (5.9%, a difference of 5.6%).
| Demographics | Rating | Rank | Unemployment Among Seniors over 75 years |
| Crow | 100.0 /100 | #1 | Exceptional 5.9% |
| Chinese | 100.0 /100 | #2 | Exceptional 5.9% |
| Cheyenne | 100.0 /100 | #3 | Exceptional 5.9% |
| Alsatians | 100.0 /100 | #4 | Exceptional 6.1% |
| Hopi | 100.0 /100 | #5 | Exceptional 6.3% |
| Immigrants | Armenia | 100.0 /100 | #6 | Exceptional 6.5% |
| Spanish American Indians | 100.0 /100 | #7 | Exceptional 6.5% |
| Taiwanese | 100.0 /100 | #8 | Exceptional 6.6% |
| Soviet Union | 100.0 /100 | #9 | Exceptional 6.6% |
| Yuman | 100.0 /100 | #10 | Exceptional 6.7% |
| Immigrants | Grenada | 100.0 /100 | #11 | Exceptional 6.7% |
| Comanche | 100.0 /100 | #12 | Exceptional 6.7% |
| Immigrants | Congo | 100.0 /100 | #13 | Exceptional 6.7% |
| Ute | 100.0 /100 | #14 | Exceptional 6.8% |
| Icelanders | 100.0 /100 | #15 | Exceptional 7.0% |