Immigrants from Costa Rica vs Choctaw Unemployment Among Ages 45 to 54 years
COMPARE
Immigrants from Costa Rica
Choctaw
Unemployment Among Ages 45 to 54 years
Unemployment Among Ages 45 to 54 years Comparison
Immigrants from Costa Rica
Choctaw
4.6%
UNEMPLOYMENT AMONG AGES 45 TO 54 YEARS
19.7/ 100
METRIC RATING
201st/ 347
METRIC RANK
4.7%
UNEMPLOYMENT AMONG AGES 45 TO 54 YEARS
6.1/ 100
METRIC RATING
221st/ 347
METRIC RANK
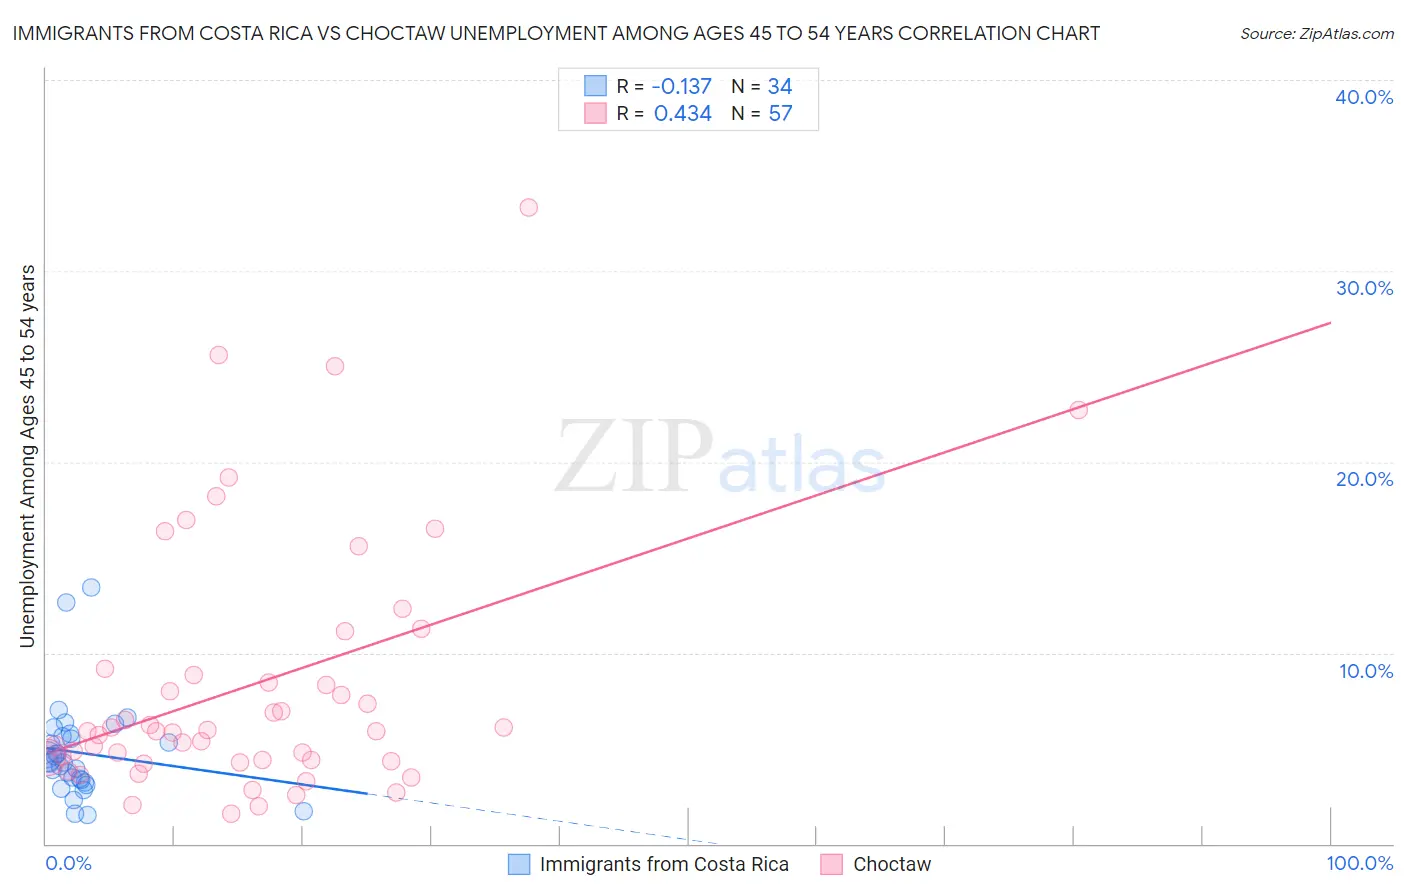
Immigrants from Costa Rica vs Choctaw Unemployment Among Ages 45 to 54 years Correlation Chart
The statistical analysis conducted on geographies consisting of 202,460,397 people shows a poor negative correlation between the proportion of Immigrants from Costa Rica and unemployment rate among population between the ages 45 and 54 in the United States with a correlation coefficient (R) of -0.137 and weighted average of 4.6%. Similarly, the statistical analysis conducted on geographies consisting of 262,857,904 people shows a moderate positive correlation between the proportion of Choctaw and unemployment rate among population between the ages 45 and 54 in the United States with a correlation coefficient (R) of 0.434 and weighted average of 4.7%, a difference of 1.5%.
Unemployment Among Ages 45 to 54 years Correlation Summary
| Measurement | Immigrants from Costa Rica | Choctaw |
| Minimum | 1.5% | 1.6% |
| Maximum | 13.4% | 33.3% |
| Range | 11.9% | 31.7% |
| Mean | 4.8% | 8.3% |
| Median | 4.4% | 5.9% |
| Interquartile 25% (IQ1) | 3.3% | 4.3% |
| Interquartile 75% (IQ3) | 5.6% | 9.0% |
| Interquartile Range (IQR) | 2.3% | 4.6% |
| Standard Deviation (Sample) | 2.5% | 6.7% |
| Standard Deviation (Population) | 2.5% | 6.6% |
Demographics Similar to Immigrants from Costa Rica and Choctaw by Unemployment Among Ages 45 to 54 years
In terms of unemployment among ages 45 to 54 years, the demographic groups most similar to Immigrants from Costa Rica are Immigrants from Peru (4.6%, a difference of 0.040%), Liberian (4.6%, a difference of 0.070%), Immigrants from Morocco (4.6%, a difference of 0.22%), Immigrants from Greece (4.6%, a difference of 0.27%), and Immigrants from Switzerland (4.6%, a difference of 0.47%). Similarly, the demographic groups most similar to Choctaw are Guamanian/Chamorro (4.7%, a difference of 0.13%), Nigerian (4.7%, a difference of 0.15%), Immigrants from Uganda (4.7%, a difference of 0.18%), Immigrants from Cambodia (4.7%, a difference of 0.23%), and Lumbee (4.6%, a difference of 0.50%).
| Demographics | Rating | Rank | Unemployment Among Ages 45 to 54 years |
| Immigrants | Costa Rica | 19.7 /100 | #201 | Poor 4.6% |
| Immigrants | Peru | 19.1 /100 | #202 | Poor 4.6% |
| Liberians | 18.7 /100 | #203 | Poor 4.6% |
| Immigrants | Morocco | 16.8 /100 | #204 | Poor 4.6% |
| Immigrants | Greece | 16.2 /100 | #205 | Poor 4.6% |
| Immigrants | Switzerland | 14.0 /100 | #206 | Poor 4.6% |
| Arabs | 13.7 /100 | #207 | Poor 4.6% |
| Immigrants | Africa | 13.6 /100 | #208 | Poor 4.6% |
| Immigrants | Nigeria | 13.3 /100 | #209 | Poor 4.6% |
| Immigrants | South America | 12.2 /100 | #210 | Poor 4.6% |
| Creek | 11.9 /100 | #211 | Poor 4.6% |
| Immigrants | Iran | 11.5 /100 | #212 | Poor 4.6% |
| Panamanians | 10.7 /100 | #213 | Poor 4.6% |
| Cherokee | 10.6 /100 | #214 | Poor 4.6% |
| Immigrants | Panama | 10.4 /100 | #215 | Poor 4.6% |
| Lumbee | 9.2 /100 | #216 | Tragic 4.6% |
| Immigrants | Cambodia | 7.4 /100 | #217 | Tragic 4.7% |
| Immigrants | Uganda | 7.1 /100 | #218 | Tragic 4.7% |
| Nigerians | 7.0 /100 | #219 | Tragic 4.7% |
| Guamanians/Chamorros | 6.8 /100 | #220 | Tragic 4.7% |
| Choctaw | 6.1 /100 | #221 | Tragic 4.7% |