Immigrants from Congo vs Sri Lankan Unemployment Among Ages 16 to 19 years
COMPARE
Immigrants from Congo
Sri Lankan
Unemployment Among Ages 16 to 19 years
Unemployment Among Ages 16 to 19 years Comparison
Immigrants from Congo
Sri Lankans
16.3%
UNEMPLOYMENT AMONG AGES 16 TO 19 YEARS
99.8/ 100
METRIC RATING
37th/ 347
METRIC RANK
16.5%
UNEMPLOYMENT AMONG AGES 16 TO 19 YEARS
99.5/ 100
METRIC RATING
56th/ 347
METRIC RANK
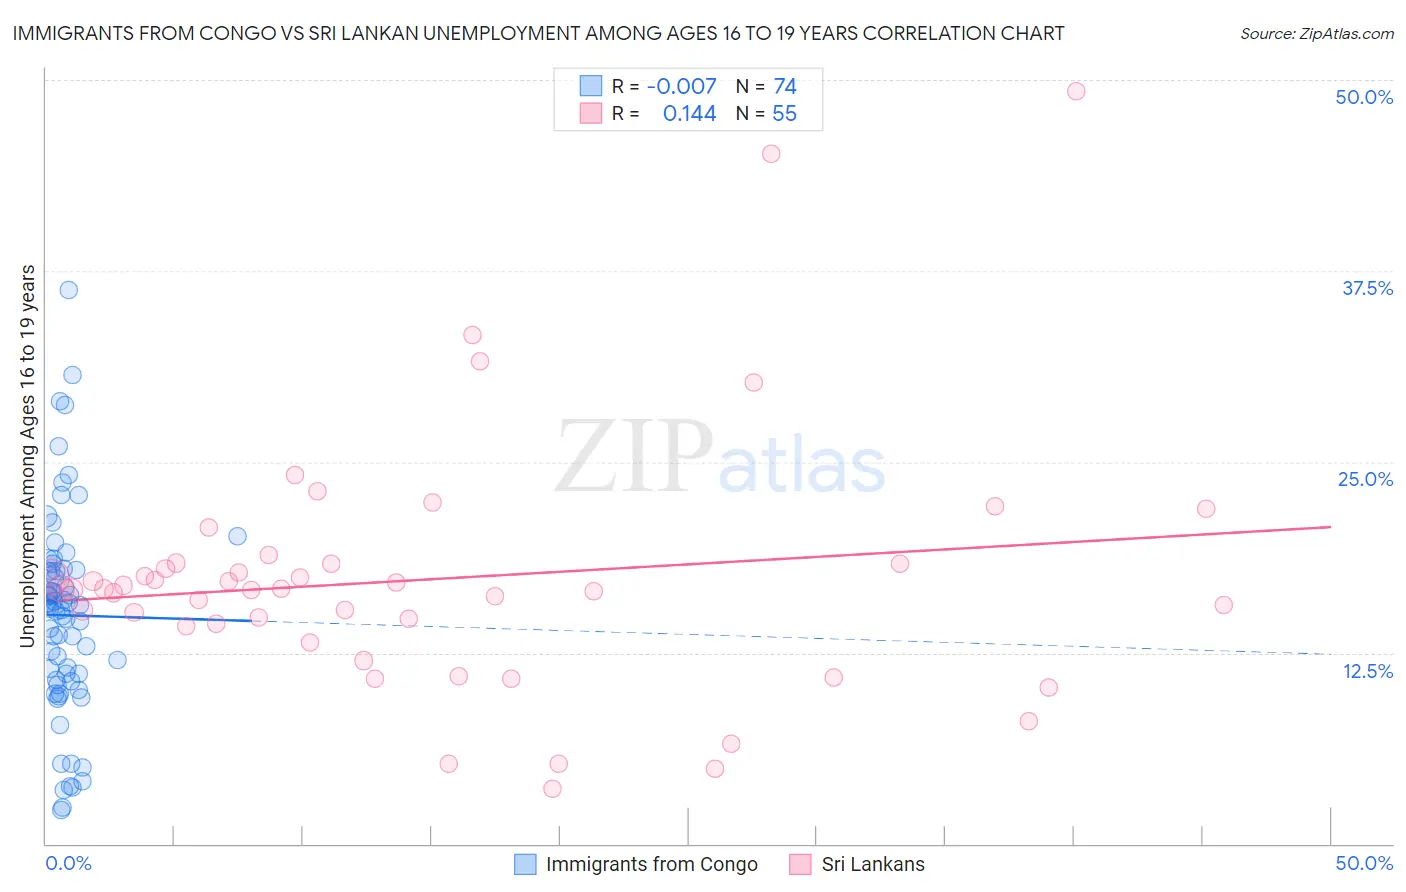
Immigrants from Congo vs Sri Lankan Unemployment Among Ages 16 to 19 years Correlation Chart
The statistical analysis conducted on geographies consisting of 91,550,138 people shows no correlation between the proportion of Immigrants from Congo and unemployment rate among population between the ages 16 and 19 in the United States with a correlation coefficient (R) of -0.007 and weighted average of 16.3%. Similarly, the statistical analysis conducted on geographies consisting of 416,928,675 people shows a poor positive correlation between the proportion of Sri Lankans and unemployment rate among population between the ages 16 and 19 in the United States with a correlation coefficient (R) of 0.144 and weighted average of 16.5%, a difference of 1.3%.
Unemployment Among Ages 16 to 19 years Correlation Summary
| Measurement | Immigrants from Congo | Sri Lankan |
| Minimum | 2.2% | 3.6% |
| Maximum | 36.3% | 49.3% |
| Range | 34.1% | 45.7% |
| Mean | 15.0% | 17.3% |
| Median | 15.5% | 16.7% |
| Interquartile 25% (IQ1) | 10.7% | 14.2% |
| Interquartile 75% (IQ3) | 17.9% | 18.3% |
| Interquartile Range (IQR) | 7.2% | 4.1% |
| Standard Deviation (Sample) | 6.6% | 8.3% |
| Standard Deviation (Population) | 6.6% | 8.3% |
Demographics Similar to Immigrants from Congo and Sri Lankans by Unemployment Among Ages 16 to 19 years
In terms of unemployment among ages 16 to 19 years, the demographic groups most similar to Immigrants from Congo are Bulgarian (16.3%, a difference of 0.020%), Immigrants from South Central Asia (16.2%, a difference of 0.10%), Croatian (16.3%, a difference of 0.13%), Hmong (16.3%, a difference of 0.24%), and Immigrants from Nepal (16.3%, a difference of 0.34%). Similarly, the demographic groups most similar to Sri Lankans are Czechoslovakian (16.5%, a difference of 0.020%), British (16.5%, a difference of 0.050%), Slovene (16.4%, a difference of 0.10%), Welsh (16.4%, a difference of 0.18%), and Lebanese (16.4%, a difference of 0.22%).
| Demographics | Rating | Rank | Unemployment Among Ages 16 to 19 years |
| Immigrants | South Central Asia | 99.8 /100 | #36 | Exceptional 16.2% |
| Immigrants | Congo | 99.8 /100 | #37 | Exceptional 16.3% |
| Bulgarians | 99.8 /100 | #38 | Exceptional 16.3% |
| Croatians | 99.8 /100 | #39 | Exceptional 16.3% |
| Hmong | 99.8 /100 | #40 | Exceptional 16.3% |
| Immigrants | Nepal | 99.8 /100 | #41 | Exceptional 16.3% |
| Fijians | 99.8 /100 | #42 | Exceptional 16.3% |
| Immigrants | Lebanon | 99.8 /100 | #43 | Exceptional 16.3% |
| Immigrants | Zimbabwe | 99.7 /100 | #44 | Exceptional 16.3% |
| Poles | 99.7 /100 | #45 | Exceptional 16.4% |
| Immigrants | North Macedonia | 99.7 /100 | #46 | Exceptional 16.4% |
| Immigrants | Vietnam | 99.7 /100 | #47 | Exceptional 16.4% |
| Maltese | 99.7 /100 | #48 | Exceptional 16.4% |
| Iraqis | 99.7 /100 | #49 | Exceptional 16.4% |
| Bhutanese | 99.6 /100 | #50 | Exceptional 16.4% |
| Lebanese | 99.6 /100 | #51 | Exceptional 16.4% |
| Welsh | 99.6 /100 | #52 | Exceptional 16.4% |
| Slovenes | 99.6 /100 | #53 | Exceptional 16.4% |
| British | 99.5 /100 | #54 | Exceptional 16.5% |
| Czechoslovakians | 99.5 /100 | #55 | Exceptional 16.5% |
| Sri Lankans | 99.5 /100 | #56 | Exceptional 16.5% |