Immigrants from Colombia vs Peruvian Unemployment Among Ages 35 to 44 years
COMPARE
Immigrants from Colombia
Peruvian
Unemployment Among Ages 35 to 44 years
Unemployment Among Ages 35 to 44 years Comparison
Immigrants from Colombia
Peruvians
4.6%
UNEMPLOYMENT AMONG AGES 35 TO 44 YEARS
82.6/ 100
METRIC RATING
131st/ 347
METRIC RANK
4.7%
UNEMPLOYMENT AMONG AGES 35 TO 44 YEARS
54.4/ 100
METRIC RATING
167th/ 347
METRIC RANK
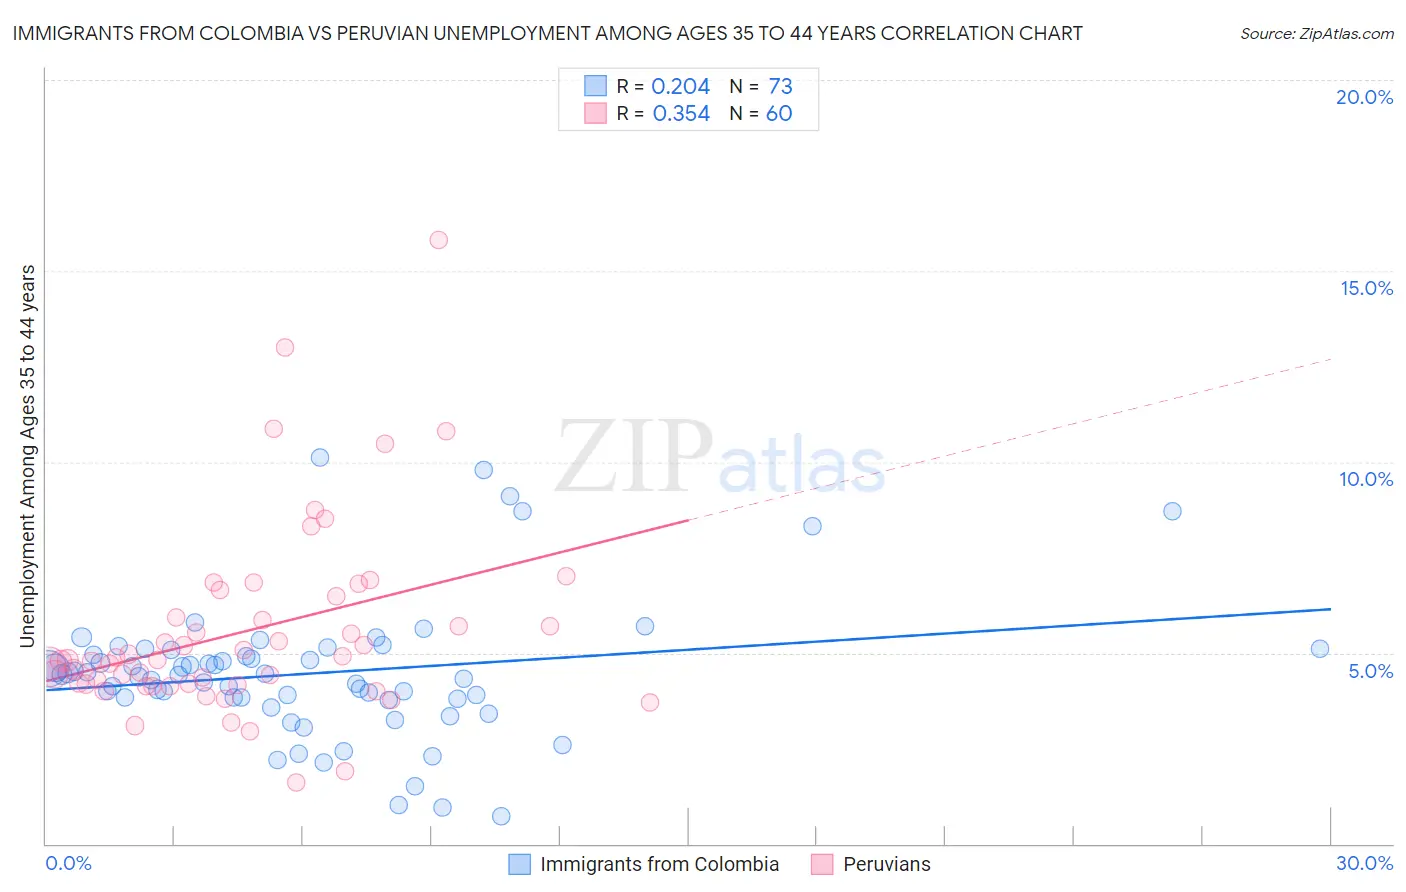
Immigrants from Colombia vs Peruvian Unemployment Among Ages 35 to 44 years Correlation Chart
The statistical analysis conducted on geographies consisting of 371,726,560 people shows a weak positive correlation between the proportion of Immigrants from Colombia and unemployment rate among population between the ages 35 and 44 in the United States with a correlation coefficient (R) of 0.204 and weighted average of 4.6%. Similarly, the statistical analysis conducted on geographies consisting of 357,234,529 people shows a mild positive correlation between the proportion of Peruvians and unemployment rate among population between the ages 35 and 44 in the United States with a correlation coefficient (R) of 0.354 and weighted average of 4.7%, a difference of 2.5%.
Unemployment Among Ages 35 to 44 years Correlation Summary
| Measurement | Immigrants from Colombia | Peruvian |
| Minimum | 0.71% | 1.6% |
| Maximum | 10.1% | 15.8% |
| Range | 9.4% | 14.2% |
| Mean | 4.5% | 5.6% |
| Median | 4.4% | 4.8% |
| Interquartile 25% (IQ1) | 3.8% | 4.2% |
| Interquartile 75% (IQ3) | 5.0% | 6.2% |
| Interquartile Range (IQR) | 1.2% | 2.0% |
| Standard Deviation (Sample) | 1.8% | 2.5% |
| Standard Deviation (Population) | 1.8% | 2.5% |
Similar Demographics by Unemployment Among Ages 35 to 44 years
Demographics Similar to Immigrants from Colombia by Unemployment Among Ages 35 to 44 years
In terms of unemployment among ages 35 to 44 years, the demographic groups most similar to Immigrants from Colombia are Immigrants from Eritrea (4.6%, a difference of 0.020%), Immigrants from Croatia (4.6%, a difference of 0.060%), Czechoslovakian (4.6%, a difference of 0.10%), Colombian (4.6%, a difference of 0.22%), and Syrian (4.6%, a difference of 0.24%).
| Demographics | Rating | Rank | Unemployment Among Ages 35 to 44 years |
| Immigrants | Spain | 86.1 /100 | #124 | Excellent 4.5% |
| Immigrants | Northern Africa | 86.1 /100 | #125 | Excellent 4.5% |
| Immigrants | Austria | 84.7 /100 | #126 | Excellent 4.5% |
| Immigrants | Ethiopia | 84.7 /100 | #127 | Excellent 4.5% |
| Czechoslovakians | 83.4 /100 | #128 | Excellent 4.6% |
| Immigrants | Croatia | 83.1 /100 | #129 | Excellent 4.6% |
| Immigrants | Eritrea | 82.8 /100 | #130 | Excellent 4.6% |
| Immigrants | Colombia | 82.6 /100 | #131 | Excellent 4.6% |
| Colombians | 80.8 /100 | #132 | Excellent 4.6% |
| Syrians | 80.7 /100 | #133 | Excellent 4.6% |
| Laotians | 80.1 /100 | #134 | Excellent 4.6% |
| Immigrants | Europe | 79.4 /100 | #135 | Good 4.6% |
| Scotch-Irish | 79.3 /100 | #136 | Good 4.6% |
| Immigrants | Iraq | 78.9 /100 | #137 | Good 4.6% |
| Immigrants | Norway | 77.5 /100 | #138 | Good 4.6% |
Demographics Similar to Peruvians by Unemployment Among Ages 35 to 44 years
In terms of unemployment among ages 35 to 44 years, the demographic groups most similar to Peruvians are French (4.7%, a difference of 0.090%), Arab (4.7%, a difference of 0.090%), Pennsylvania German (4.7%, a difference of 0.10%), Immigrants from Indonesia (4.7%, a difference of 0.13%), and Indonesian (4.7%, a difference of 0.19%).
| Demographics | Rating | Rank | Unemployment Among Ages 35 to 44 years |
| Hungarians | 62.6 /100 | #160 | Good 4.6% |
| Celtics | 61.7 /100 | #161 | Good 4.7% |
| Costa Ricans | 59.6 /100 | #162 | Average 4.7% |
| South Africans | 58.5 /100 | #163 | Average 4.7% |
| Immigrants | Morocco | 57.2 /100 | #164 | Average 4.7% |
| German Russians | 57.2 /100 | #165 | Average 4.7% |
| French | 55.6 /100 | #166 | Average 4.7% |
| Peruvians | 54.4 /100 | #167 | Average 4.7% |
| Arabs | 53.1 /100 | #168 | Average 4.7% |
| Pennsylvania Germans | 53.0 /100 | #169 | Average 4.7% |
| Immigrants | Indonesia | 52.6 /100 | #170 | Average 4.7% |
| Indonesians | 51.7 /100 | #171 | Average 4.7% |
| Lebanese | 51.4 /100 | #172 | Average 4.7% |
| Iraqis | 50.9 /100 | #173 | Average 4.7% |
| Afghans | 50.0 /100 | #174 | Average 4.7% |