Immigrants from Colombia vs French Canadian Unemployment Among Seniors over 65 years
COMPARE
Immigrants from Colombia
French Canadian
Unemployment Among Seniors over 65 years
Unemployment Among Seniors over 65 years Comparison
Immigrants from Colombia
French Canadians
5.4%
UNEMPLOYMENT AMONG SENIORS OVER 65 YEARS
0.2/ 100
METRIC RATING
265th/ 347
METRIC RANK
5.4%
UNEMPLOYMENT AMONG SENIORS OVER 65 YEARS
0.7/ 100
METRIC RATING
248th/ 347
METRIC RANK
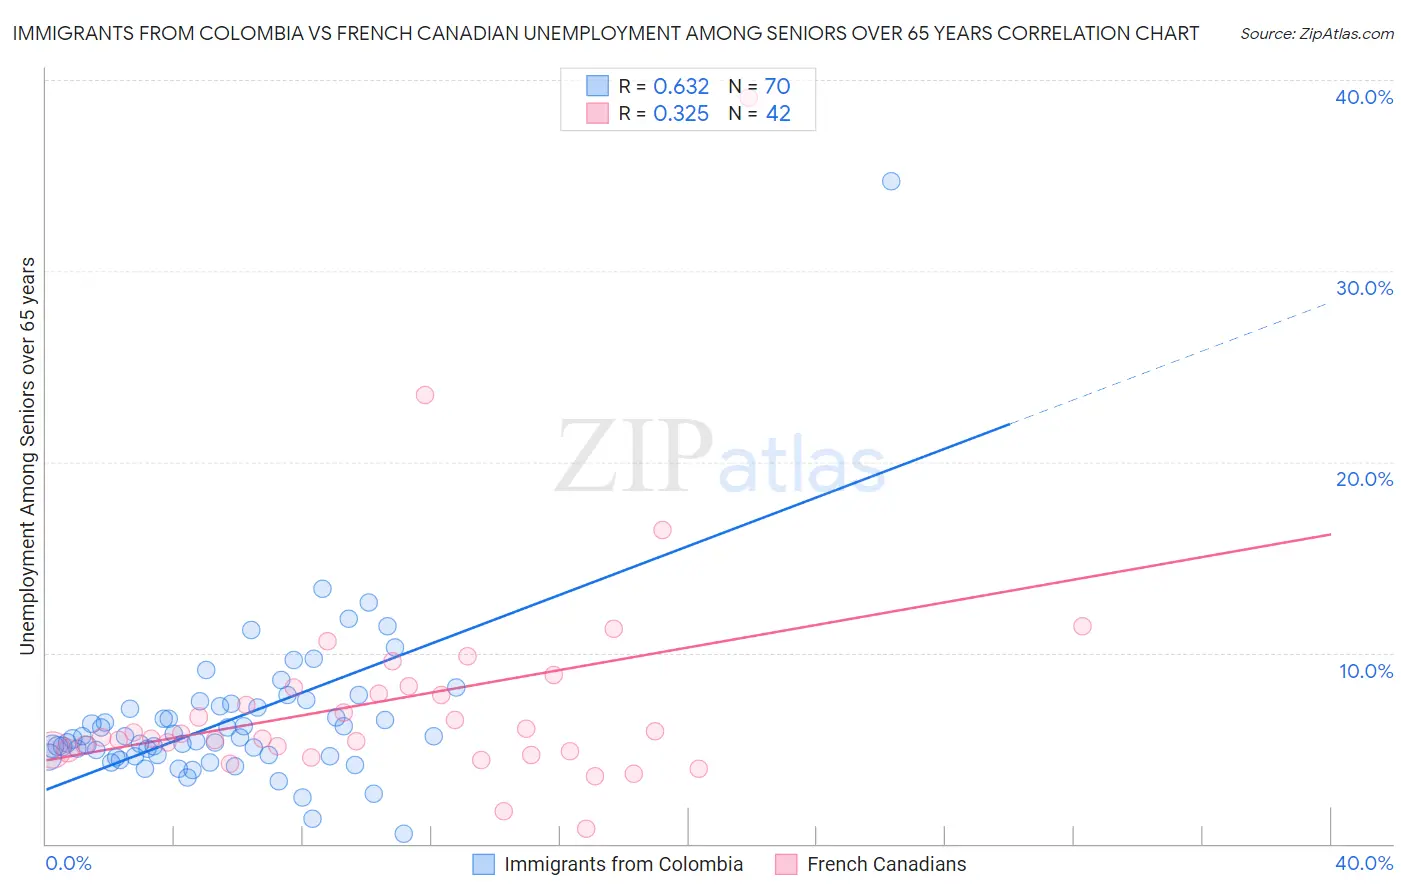
Immigrants from Colombia vs French Canadian Unemployment Among Seniors over 65 years Correlation Chart
The statistical analysis conducted on geographies consisting of 345,821,910 people shows a significant positive correlation between the proportion of Immigrants from Colombia and unemployment rate amomg seniors over the age of 65 in the United States with a correlation coefficient (R) of 0.632 and weighted average of 5.4%. Similarly, the statistical analysis conducted on geographies consisting of 425,839,170 people shows a mild positive correlation between the proportion of French Canadians and unemployment rate amomg seniors over the age of 65 in the United States with a correlation coefficient (R) of 0.325 and weighted average of 5.4%, a difference of 1.0%.
Unemployment Among Seniors over 65 years Correlation Summary
| Measurement | Immigrants from Colombia | French Canadian |
| Minimum | 0.50% | 0.80% |
| Maximum | 34.7% | 39.1% |
| Range | 34.2% | 38.3% |
| Mean | 6.5% | 7.6% |
| Median | 5.5% | 5.7% |
| Interquartile 25% (IQ1) | 4.6% | 4.9% |
| Interquartile 75% (IQ3) | 7.2% | 8.2% |
| Interquartile Range (IQR) | 2.6% | 3.3% |
| Standard Deviation (Sample) | 4.2% | 6.3% |
| Standard Deviation (Population) | 4.2% | 6.2% |
Demographics Similar to Immigrants from Colombia and French Canadians by Unemployment Among Seniors over 65 years
In terms of unemployment among seniors over 65 years, the demographic groups most similar to Immigrants from Colombia are Central American Indian (5.4%, a difference of 0.010%), Pennsylvania German (5.4%, a difference of 0.020%), South American (5.4%, a difference of 0.13%), Immigrants from Grenada (5.4%, a difference of 0.18%), and Spanish American Indian (5.4%, a difference of 0.25%). Similarly, the demographic groups most similar to French Canadians are Immigrants (5.4%, a difference of 0.020%), Ghanaian (5.4%, a difference of 0.030%), West Indian (5.4%, a difference of 0.030%), Immigrants from Caribbean (5.3%, a difference of 0.050%), and Colombian (5.3%, a difference of 0.090%).
| Demographics | Rating | Rank | Unemployment Among Seniors over 65 years |
| Colombians | 0.7 /100 | #246 | Tragic 5.3% |
| Immigrants | Caribbean | 0.7 /100 | #247 | Tragic 5.3% |
| French Canadians | 0.7 /100 | #248 | Tragic 5.4% |
| Immigrants | Immigrants | 0.6 /100 | #249 | Tragic 5.4% |
| Ghanaians | 0.6 /100 | #250 | Tragic 5.4% |
| West Indians | 0.6 /100 | #251 | Tragic 5.4% |
| Trinidadians and Tobagonians | 0.6 /100 | #252 | Tragic 5.4% |
| Immigrants | Sierra Leone | 0.6 /100 | #253 | Tragic 5.4% |
| Paraguayans | 0.5 /100 | #254 | Tragic 5.4% |
| Immigrants | Peru | 0.5 /100 | #255 | Tragic 5.4% |
| Moroccans | 0.5 /100 | #256 | Tragic 5.4% |
| Immigrants | Micronesia | 0.4 /100 | #257 | Tragic 5.4% |
| Sierra Leoneans | 0.4 /100 | #258 | Tragic 5.4% |
| Immigrants | Ghana | 0.4 /100 | #259 | Tragic 5.4% |
| Native Hawaiians | 0.3 /100 | #260 | Tragic 5.4% |
| Spanish American Indians | 0.2 /100 | #261 | Tragic 5.4% |
| Immigrants | Grenada | 0.2 /100 | #262 | Tragic 5.4% |
| South Americans | 0.2 /100 | #263 | Tragic 5.4% |
| Central American Indians | 0.2 /100 | #264 | Tragic 5.4% |
| Immigrants | Colombia | 0.2 /100 | #265 | Tragic 5.4% |
| Pennsylvania Germans | 0.2 /100 | #266 | Tragic 5.4% |