Immigrants from China vs Chippewa Unemployment Among Seniors over 65 years
COMPARE
Immigrants from China
Chippewa
Unemployment Among Seniors over 65 years
Unemployment Among Seniors over 65 years Comparison
Immigrants from China
Chippewa
5.2%
UNEMPLOYMENT AMONG SENIORS OVER 65 YEARS
16.9/ 100
METRIC RATING
204th/ 347
METRIC RANK
5.4%
UNEMPLOYMENT AMONG SENIORS OVER 65 YEARS
0.2/ 100
METRIC RATING
267th/ 347
METRIC RANK
Immigrants from China vs Chippewa Unemployment Among Seniors over 65 years Correlation Chart
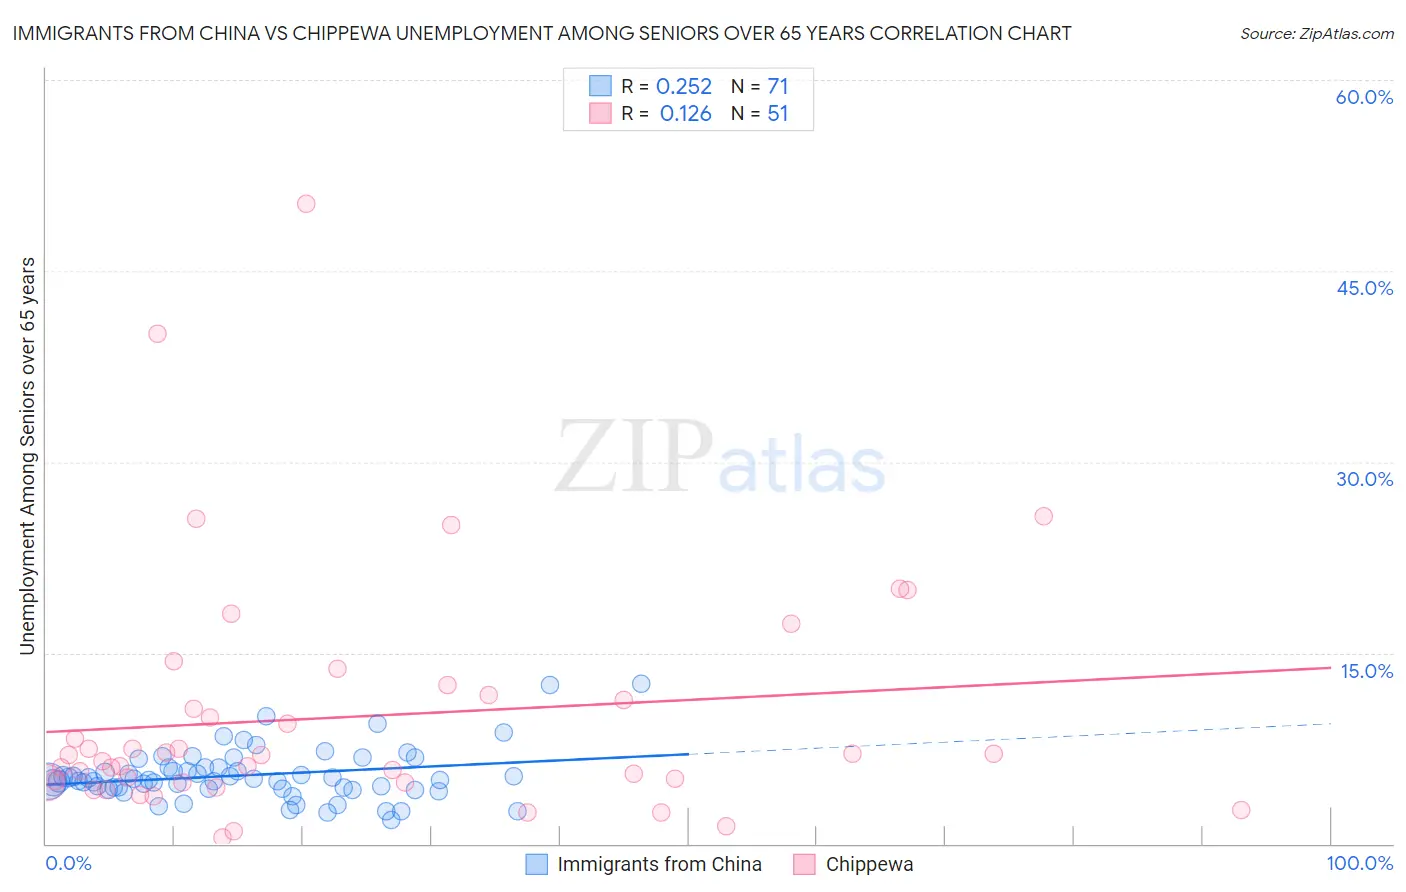
The statistical analysis conducted on geographies consisting of 404,398,266 people shows a weak positive correlation between the proportion of Immigrants from China and unemployment rate amomg seniors over the age of 65 in the United States with a correlation coefficient (R) of 0.252 and weighted average of 5.2%. Similarly, the statistical analysis conducted on geographies consisting of 194,992,138 people shows a poor positive correlation between the proportion of Chippewa and unemployment rate amomg seniors over the age of 65 in the United States with a correlation coefficient (R) of 0.126 and weighted average of 5.4%, a difference of 3.8%.
Unemployment Among Seniors over 65 years Correlation Summary
| Measurement | Immigrants from China | Chippewa |
| Minimum | 1.8% | 0.50% |
| Maximum | 12.6% | 50.3% |
| Range | 10.8% | 49.8% |
| Mean | 5.4% | 10.0% |
| Median | 5.0% | 7.0% |
| Interquartile 25% (IQ1) | 4.3% | 4.8% |
| Interquartile 75% (IQ3) | 6.0% | 11.7% |
| Interquartile Range (IQR) | 1.7% | 6.9% |
| Standard Deviation (Sample) | 2.0% | 9.5% |
| Standard Deviation (Population) | 2.0% | 9.4% |
Similar Demographics by Unemployment Among Seniors over 65 years
Demographics Similar to Immigrants from China by Unemployment Among Seniors over 65 years
In terms of unemployment among seniors over 65 years, the demographic groups most similar to Immigrants from China are Subsaharan African (5.2%, a difference of 0.010%), Immigrants from Northern Africa (5.2%, a difference of 0.040%), Laotian (5.2%, a difference of 0.060%), Immigrants from Pakistan (5.2%, a difference of 0.080%), and South American Indian (5.2%, a difference of 0.10%).
| Demographics | Rating | Rank | Unemployment Among Seniors over 65 years |
| Guamanians/Chamorros | 22.5 /100 | #197 | Fair 5.2% |
| Maltese | 19.6 /100 | #198 | Poor 5.2% |
| Immigrants | Europe | 19.0 /100 | #199 | Poor 5.2% |
| Immigrants | Pakistan | 18.4 /100 | #200 | Poor 5.2% |
| Laotians | 18.1 /100 | #201 | Poor 5.2% |
| Immigrants | Northern Africa | 17.7 /100 | #202 | Poor 5.2% |
| Sub-Saharan Africans | 17.1 /100 | #203 | Poor 5.2% |
| Immigrants | China | 16.9 /100 | #204 | Poor 5.2% |
| South American Indians | 15.3 /100 | #205 | Poor 5.2% |
| German Russians | 14.7 /100 | #206 | Poor 5.2% |
| Immigrants | Philippines | 13.2 /100 | #207 | Poor 5.2% |
| Uruguayans | 12.6 /100 | #208 | Poor 5.2% |
| Alsatians | 11.4 /100 | #209 | Poor 5.2% |
| Immigrants | Uzbekistan | 10.7 /100 | #210 | Poor 5.2% |
| Africans | 10.4 /100 | #211 | Poor 5.2% |
Demographics Similar to Chippewa by Unemployment Among Seniors over 65 years
In terms of unemployment among seniors over 65 years, the demographic groups most similar to Chippewa are Pennsylvania German (5.4%, a difference of 0.0%), Immigrants from Colombia (5.4%, a difference of 0.020%), Central American Indian (5.4%, a difference of 0.030%), Hawaiian (5.4%, a difference of 0.10%), and South American (5.4%, a difference of 0.15%).
| Demographics | Rating | Rank | Unemployment Among Seniors over 65 years |
| Native Hawaiians | 0.3 /100 | #260 | Tragic 5.4% |
| Spanish American Indians | 0.2 /100 | #261 | Tragic 5.4% |
| Immigrants | Grenada | 0.2 /100 | #262 | Tragic 5.4% |
| South Americans | 0.2 /100 | #263 | Tragic 5.4% |
| Central American Indians | 0.2 /100 | #264 | Tragic 5.4% |
| Immigrants | Colombia | 0.2 /100 | #265 | Tragic 5.4% |
| Pennsylvania Germans | 0.2 /100 | #266 | Tragic 5.4% |
| Chippewa | 0.2 /100 | #267 | Tragic 5.4% |
| Hawaiians | 0.1 /100 | #268 | Tragic 5.4% |
| Immigrants | Southern Europe | 0.1 /100 | #269 | Tragic 5.4% |
| Immigrants | Morocco | 0.1 /100 | #270 | Tragic 5.4% |
| Cypriots | 0.1 /100 | #271 | Tragic 5.4% |
| Immigrants | Jamaica | 0.1 /100 | #272 | Tragic 5.4% |
| Immigrants | Nigeria | 0.1 /100 | #273 | Tragic 5.4% |
| Immigrants | Brazil | 0.1 /100 | #274 | Tragic 5.4% |