Immigrants from Chile vs Romanian Unemployment Among Ages 25 to 29 years
COMPARE
Immigrants from Chile
Romanian
Unemployment Among Ages 25 to 29 years
Unemployment Among Ages 25 to 29 years Comparison
Immigrants from Chile
Romanians
6.5%
UNEMPLOYMENT AMONG AGES 25 TO 29 YEARS
80.5/ 100
METRIC RATING
128th/ 347
METRIC RANK
6.6%
UNEMPLOYMENT AMONG AGES 25 TO 29 YEARS
69.5/ 100
METRIC RATING
146th/ 347
METRIC RANK
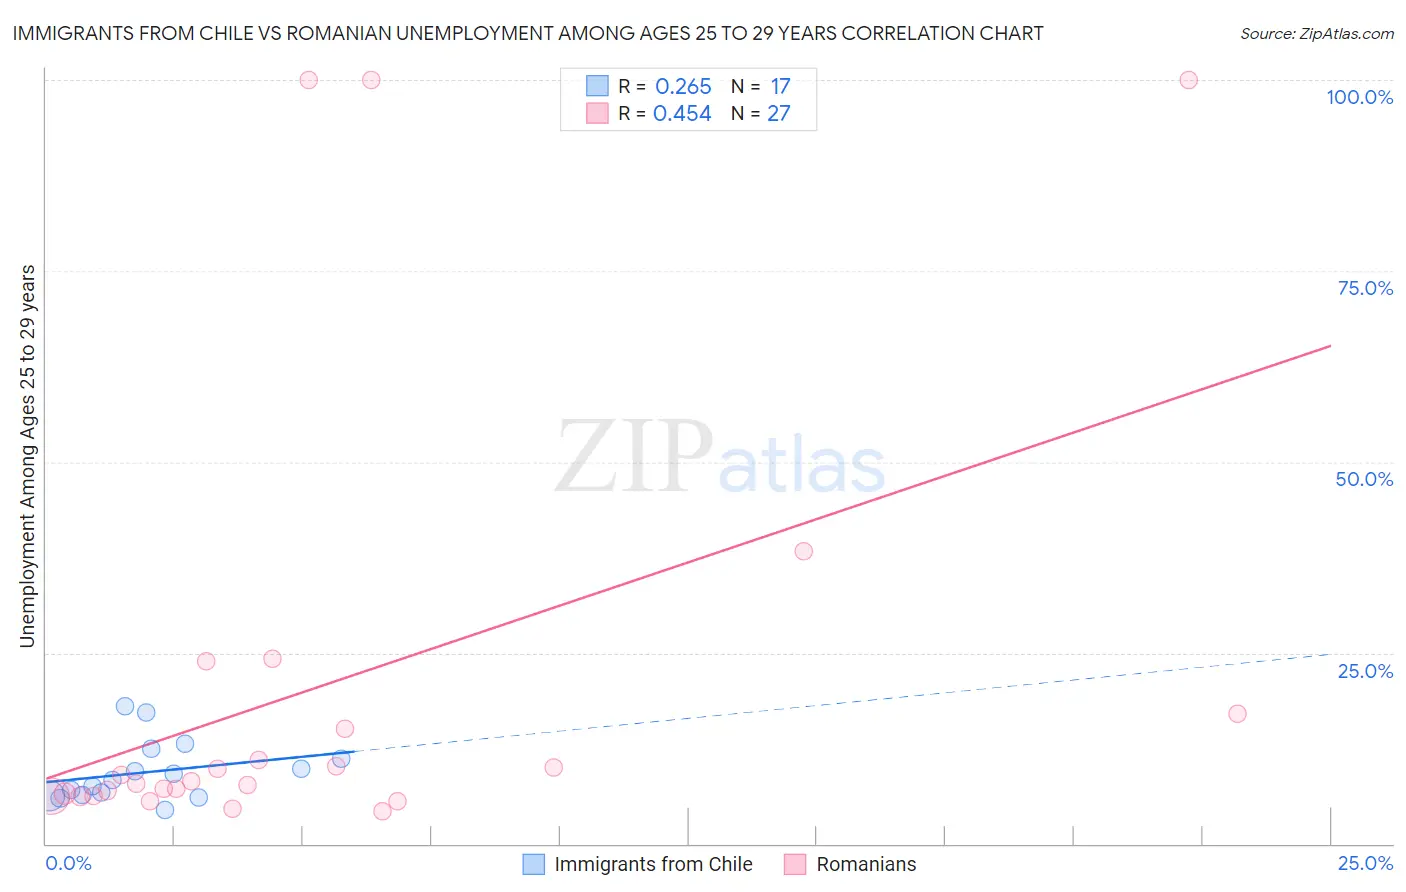
Immigrants from Chile vs Romanian Unemployment Among Ages 25 to 29 years Correlation Chart
The statistical analysis conducted on geographies consisting of 212,936,295 people shows a weak positive correlation between the proportion of Immigrants from Chile and unemployment rate among population between the ages 25 and 29 in the United States with a correlation coefficient (R) of 0.265 and weighted average of 6.5%. Similarly, the statistical analysis conducted on geographies consisting of 358,264,934 people shows a moderate positive correlation between the proportion of Romanians and unemployment rate among population between the ages 25 and 29 in the United States with a correlation coefficient (R) of 0.454 and weighted average of 6.6%, a difference of 0.93%.
Unemployment Among Ages 25 to 29 years Correlation Summary
| Measurement | Immigrants from Chile | Romanian |
| Minimum | 4.4% | 4.3% |
| Maximum | 18.0% | 100.0% |
| Range | 13.6% | 95.7% |
| Mean | 9.4% | 20.7% |
| Median | 8.4% | 8.2% |
| Interquartile 25% (IQ1) | 6.3% | 6.3% |
| Interquartile 75% (IQ3) | 11.8% | 17.0% |
| Interquartile Range (IQR) | 5.4% | 10.7% |
| Standard Deviation (Sample) | 3.9% | 29.5% |
| Standard Deviation (Population) | 3.8% | 29.0% |
Demographics Similar to Immigrants from Chile and Romanians by Unemployment Among Ages 25 to 29 years
In terms of unemployment among ages 25 to 29 years, the demographic groups most similar to Immigrants from Chile are Dutch (6.5%, a difference of 0.020%), Sri Lankan (6.5%, a difference of 0.020%), Immigrants from Peru (6.5%, a difference of 0.050%), Immigrants from Afghanistan (6.5%, a difference of 0.13%), and Polish (6.5%, a difference of 0.36%). Similarly, the demographic groups most similar to Romanians are Nicaraguan (6.6%, a difference of 0.050%), Immigrants from Thailand (6.6%, a difference of 0.080%), Immigrants from Micronesia (6.6%, a difference of 0.16%), Lithuanian (6.5%, a difference of 0.21%), and Slavic (6.5%, a difference of 0.23%).
| Demographics | Rating | Rank | Unemployment Among Ages 25 to 29 years |
| Dutch | 80.6 /100 | #127 | Excellent 6.5% |
| Immigrants | Chile | 80.5 /100 | #128 | Excellent 6.5% |
| Sri Lankans | 80.3 /100 | #129 | Excellent 6.5% |
| Immigrants | Peru | 79.9 /100 | #130 | Good 6.5% |
| Immigrants | Afghanistan | 79.2 /100 | #131 | Good 6.5% |
| Poles | 76.6 /100 | #132 | Good 6.5% |
| Immigrants | Europe | 75.7 /100 | #133 | Good 6.5% |
| Immigrants | Vietnam | 75.6 /100 | #134 | Good 6.5% |
| Immigrants | Croatia | 75.5 /100 | #135 | Good 6.5% |
| Northern Europeans | 75.4 /100 | #136 | Good 6.5% |
| Eastern Europeans | 74.1 /100 | #137 | Good 6.5% |
| Immigrants | Belgium | 73.8 /100 | #138 | Good 6.5% |
| Austrians | 73.8 /100 | #139 | Good 6.5% |
| Immigrants | Pakistan | 73.8 /100 | #140 | Good 6.5% |
| Maltese | 72.9 /100 | #141 | Good 6.5% |
| Slavs | 72.5 /100 | #142 | Good 6.5% |
| Lithuanians | 72.2 /100 | #143 | Good 6.5% |
| Immigrants | Micronesia | 71.5 /100 | #144 | Good 6.6% |
| Nicaraguans | 70.2 /100 | #145 | Good 6.6% |
| Romanians | 69.5 /100 | #146 | Good 6.6% |
| Immigrants | Thailand | 68.4 /100 | #147 | Good 6.6% |