Immigrants from Chile vs Immigrants from Guyana Unemployment Among Ages 20 to 24 years
COMPARE
Immigrants from Chile
Immigrants from Guyana
Unemployment Among Ages 20 to 24 years
Unemployment Among Ages 20 to 24 years Comparison
Immigrants from Chile
Immigrants from Guyana
10.0%
UNEMPLOYMENT AMONG AGES 20 TO 24 YEARS
94.0/ 100
METRIC RATING
104th/ 347
METRIC RANK
13.9%
UNEMPLOYMENT AMONG AGES 20 TO 24 YEARS
0.0/ 100
METRIC RATING
333rd/ 347
METRIC RANK
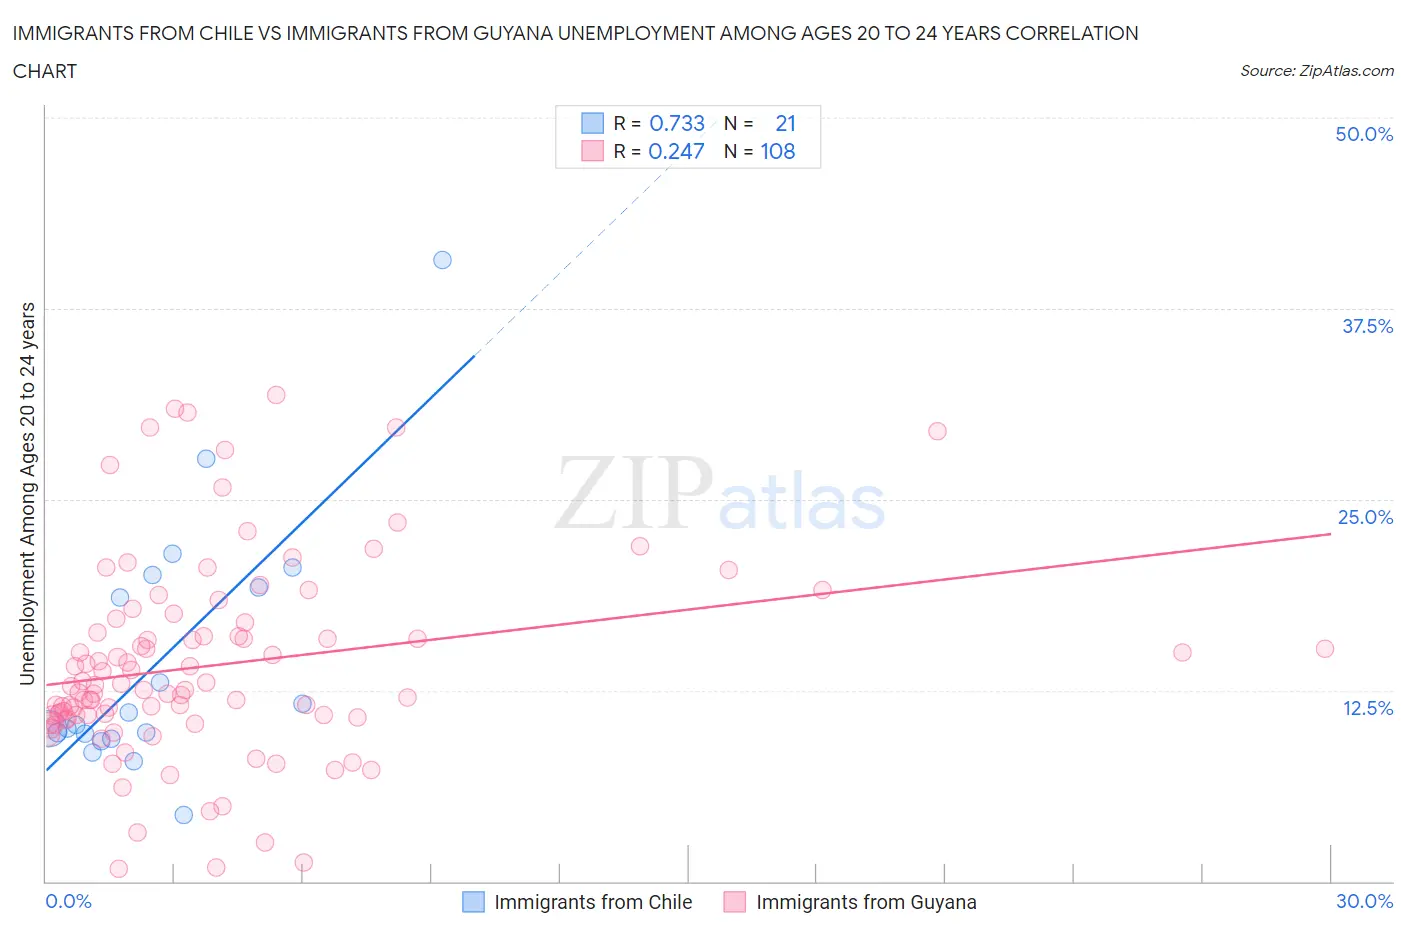
Immigrants from Chile vs Immigrants from Guyana Unemployment Among Ages 20 to 24 years Correlation Chart
The statistical analysis conducted on geographies consisting of 216,048,657 people shows a strong positive correlation between the proportion of Immigrants from Chile and unemployment rate among population between the ages 20 and 24 in the United States with a correlation coefficient (R) of 0.733 and weighted average of 10.0%. Similarly, the statistical analysis conducted on geographies consisting of 181,344,797 people shows a weak positive correlation between the proportion of Immigrants from Guyana and unemployment rate among population between the ages 20 and 24 in the United States with a correlation coefficient (R) of 0.247 and weighted average of 13.9%, a difference of 38.6%.
Unemployment Among Ages 20 to 24 years Correlation Summary
| Measurement | Immigrants from Chile | Immigrants from Guyana |
| Minimum | 4.3% | 0.80% |
| Maximum | 40.7% | 31.8% |
| Range | 36.4% | 31.0% |
| Mean | 14.4% | 14.1% |
| Median | 10.3% | 12.6% |
| Interquartile 25% (IQ1) | 9.5% | 10.8% |
| Interquartile 75% (IQ3) | 19.6% | 16.6% |
| Interquartile Range (IQR) | 10.1% | 5.8% |
| Standard Deviation (Sample) | 8.4% | 6.5% |
| Standard Deviation (Population) | 8.2% | 6.5% |
Similar Demographics by Unemployment Among Ages 20 to 24 years
Demographics Similar to Immigrants from Chile by Unemployment Among Ages 20 to 24 years
In terms of unemployment among ages 20 to 24 years, the demographic groups most similar to Immigrants from Chile are Immigrants from Hungary (10.0%, a difference of 0.010%), Pennsylvania German (10.0%, a difference of 0.030%), Irish (10.0%, a difference of 0.040%), Iroquois (10.1%, a difference of 0.10%), and Immigrants from Latvia (10.1%, a difference of 0.13%).
| Demographics | Rating | Rank | Unemployment Among Ages 20 to 24 years |
| Slavs | 96.1 /100 | #97 | Exceptional 10.0% |
| Japanese | 95.4 /100 | #98 | Exceptional 10.0% |
| Fijians | 95.3 /100 | #99 | Exceptional 10.0% |
| Immigrants | France | 95.2 /100 | #100 | Exceptional 10.0% |
| Laotians | 95.1 /100 | #101 | Exceptional 10.0% |
| Immigrants | Argentina | 94.9 /100 | #102 | Exceptional 10.0% |
| Irish | 94.3 /100 | #103 | Exceptional 10.0% |
| Immigrants | Chile | 94.0 /100 | #104 | Exceptional 10.0% |
| Immigrants | Hungary | 94.0 /100 | #105 | Exceptional 10.0% |
| Pennsylvania Germans | 93.9 /100 | #106 | Exceptional 10.0% |
| Iroquois | 93.4 /100 | #107 | Exceptional 10.1% |
| Immigrants | Latvia | 93.2 /100 | #108 | Exceptional 10.1% |
| Filipinos | 93.2 /100 | #109 | Exceptional 10.1% |
| Immigrants | Spain | 93.1 /100 | #110 | Exceptional 10.1% |
| Immigrants | Indonesia | 92.7 /100 | #111 | Exceptional 10.1% |
Demographics Similar to Immigrants from Guyana by Unemployment Among Ages 20 to 24 years
In terms of unemployment among ages 20 to 24 years, the demographic groups most similar to Immigrants from Guyana are Guyanese (14.0%, a difference of 0.50%), Immigrants from Grenada (13.8%, a difference of 0.52%), Aleut (13.8%, a difference of 0.58%), Arapaho (13.8%, a difference of 0.85%), and Dominican (13.8%, a difference of 0.93%).
| Demographics | Rating | Rank | Unemployment Among Ages 20 to 24 years |
| Immigrants | Barbados | 0.0 /100 | #326 | Tragic 13.5% |
| Immigrants | Dominican Republic | 0.0 /100 | #327 | Tragic 13.6% |
| British West Indians | 0.0 /100 | #328 | Tragic 13.7% |
| Dominicans | 0.0 /100 | #329 | Tragic 13.8% |
| Arapaho | 0.0 /100 | #330 | Tragic 13.8% |
| Aleuts | 0.0 /100 | #331 | Tragic 13.8% |
| Immigrants | Grenada | 0.0 /100 | #332 | Tragic 13.8% |
| Immigrants | Guyana | 0.0 /100 | #333 | Tragic 13.9% |
| Guyanese | 0.0 /100 | #334 | Tragic 14.0% |
| Sioux | 0.0 /100 | #335 | Tragic 14.2% |
| Pima | 0.0 /100 | #336 | Tragic 14.2% |
| Paiute | 0.0 /100 | #337 | Tragic 14.3% |
| Immigrants | St. Vincent and the Grenadines | 0.0 /100 | #338 | Tragic 14.3% |
| Immigrants | Yemen | 0.0 /100 | #339 | Tragic 14.9% |
| Yuman | 0.0 /100 | #340 | Tragic 15.8% |