Immigrants from Central America vs Northern European Unemployment Among Ages 45 to 54 years
COMPARE
Immigrants from Central America
Northern European
Unemployment Among Ages 45 to 54 years
Unemployment Among Ages 45 to 54 years Comparison
Immigrants from Central America
Northern Europeans
5.0%
UNEMPLOYMENT AMONG AGES 45 TO 54 YEARS
0.0/ 100
METRIC RATING
272nd/ 347
METRIC RANK
4.2%
UNEMPLOYMENT AMONG AGES 45 TO 54 YEARS
99.8/ 100
METRIC RATING
40th/ 347
METRIC RANK
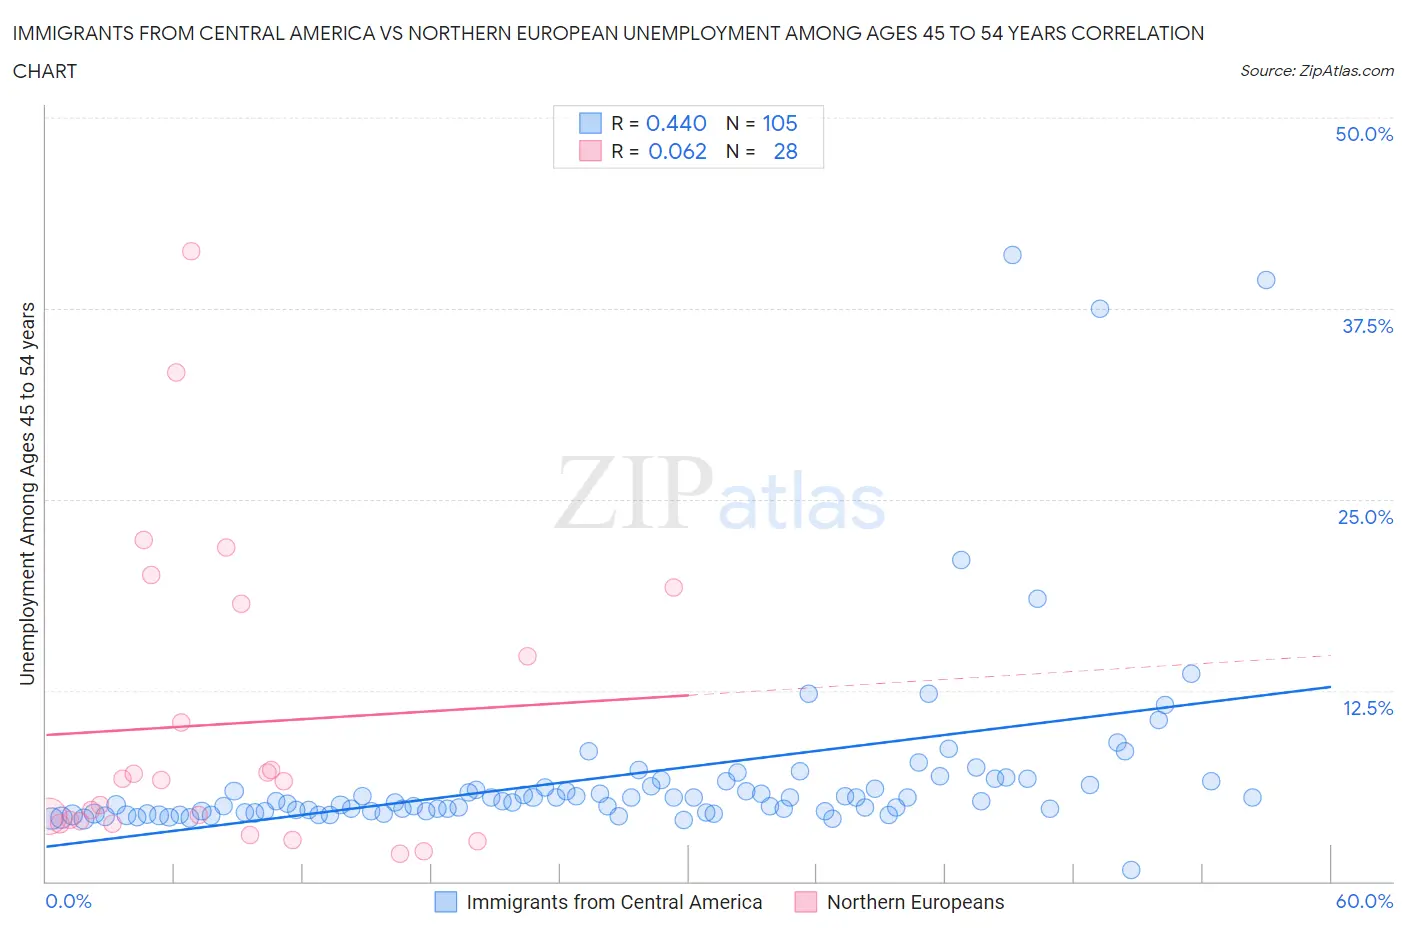
Immigrants from Central America vs Northern European Unemployment Among Ages 45 to 54 years Correlation Chart
The statistical analysis conducted on geographies consisting of 505,939,152 people shows a moderate positive correlation between the proportion of Immigrants from Central America and unemployment rate among population between the ages 45 and 54 in the United States with a correlation coefficient (R) of 0.440 and weighted average of 5.0%. Similarly, the statistical analysis conducted on geographies consisting of 391,774,207 people shows a slight positive correlation between the proportion of Northern Europeans and unemployment rate among population between the ages 45 and 54 in the United States with a correlation coefficient (R) of 0.062 and weighted average of 4.2%, a difference of 18.4%.
Unemployment Among Ages 45 to 54 years Correlation Summary
| Measurement | Immigrants from Central America | Northern European |
| Minimum | 0.70% | 1.8% |
| Maximum | 41.0% | 41.3% |
| Range | 40.3% | 39.5% |
| Mean | 6.9% | 10.3% |
| Median | 5.2% | 6.6% |
| Interquartile 25% (IQ1) | 4.5% | 3.8% |
| Interquartile 75% (IQ3) | 6.4% | 16.4% |
| Interquartile Range (IQR) | 1.9% | 12.6% |
| Standard Deviation (Sample) | 6.2% | 10.0% |
| Standard Deviation (Population) | 6.2% | 9.8% |
Similar Demographics by Unemployment Among Ages 45 to 54 years
Demographics Similar to Immigrants from Central America by Unemployment Among Ages 45 to 54 years
In terms of unemployment among ages 45 to 54 years, the demographic groups most similar to Immigrants from Central America are Immigrants from Latin America (5.0%, a difference of 0.16%), Cajun (5.0%, a difference of 0.17%), U.S. Virgin Islander (5.0%, a difference of 0.22%), Immigrants from Ghana (5.0%, a difference of 0.25%), and Bermudan (5.0%, a difference of 0.27%).
| Demographics | Rating | Rank | Unemployment Among Ages 45 to 54 years |
| Immigrants | Somalia | 0.1 /100 | #265 | Tragic 4.9% |
| Ghanaians | 0.0 /100 | #266 | Tragic 4.9% |
| Bahamians | 0.0 /100 | #267 | Tragic 4.9% |
| Immigrants | Uzbekistan | 0.0 /100 | #268 | Tragic 4.9% |
| Somalis | 0.0 /100 | #269 | Tragic 5.0% |
| Immigrants | Ghana | 0.0 /100 | #270 | Tragic 5.0% |
| Cajuns | 0.0 /100 | #271 | Tragic 5.0% |
| Immigrants | Central America | 0.0 /100 | #272 | Tragic 5.0% |
| Immigrants | Latin America | 0.0 /100 | #273 | Tragic 5.0% |
| U.S. Virgin Islanders | 0.0 /100 | #274 | Tragic 5.0% |
| Bermudans | 0.0 /100 | #275 | Tragic 5.0% |
| French American Indians | 0.0 /100 | #276 | Tragic 5.0% |
| Immigrants | Mexico | 0.0 /100 | #277 | Tragic 5.0% |
| Dutch West Indians | 0.0 /100 | #278 | Tragic 5.0% |
| Nepalese | 0.0 /100 | #279 | Tragic 5.0% |
Demographics Similar to Northern Europeans by Unemployment Among Ages 45 to 54 years
In terms of unemployment among ages 45 to 54 years, the demographic groups most similar to Northern Europeans are Czechoslovakian (4.2%, a difference of 0.020%), Immigrants from Scotland (4.2%, a difference of 0.060%), Zimbabwean (4.2%, a difference of 0.070%), Jordanian (4.2%, a difference of 0.20%), and Immigrants from Singapore (4.2%, a difference of 0.33%).
| Demographics | Rating | Rank | Unemployment Among Ages 45 to 54 years |
| Immigrants | South Central Asia | 99.9 /100 | #33 | Exceptional 4.2% |
| Dutch | 99.9 /100 | #34 | Exceptional 4.2% |
| Immigrants | Taiwan | 99.8 /100 | #35 | Exceptional 4.2% |
| Croatians | 99.8 /100 | #36 | Exceptional 4.2% |
| Osage | 99.8 /100 | #37 | Exceptional 4.2% |
| Scotch-Irish | 99.8 /100 | #38 | Exceptional 4.2% |
| Jordanians | 99.8 /100 | #39 | Exceptional 4.2% |
| Northern Europeans | 99.8 /100 | #40 | Exceptional 4.2% |
| Czechoslovakians | 99.8 /100 | #41 | Exceptional 4.2% |
| Immigrants | Scotland | 99.8 /100 | #42 | Exceptional 4.2% |
| Zimbabweans | 99.8 /100 | #43 | Exceptional 4.2% |
| Immigrants | Singapore | 99.7 /100 | #44 | Exceptional 4.2% |
| Immigrants | Bulgaria | 99.7 /100 | #45 | Exceptional 4.2% |
| Luxembourgers | 99.6 /100 | #46 | Exceptional 4.2% |
| Filipinos | 99.6 /100 | #47 | Exceptional 4.2% |