Immigrants from Central America vs Immigrants from Vietnam Unemployment Among Ages 65 to 74 years
COMPARE
Immigrants from Central America
Immigrants from Vietnam
Unemployment Among Ages 65 to 74 years
Unemployment Among Ages 65 to 74 years Comparison
Immigrants from Central America
Immigrants from Vietnam
5.9%
UNEMPLOYMENT AMONG AGES 65 TO 74 YEARS
0.0/ 100
METRIC RATING
317th/ 347
METRIC RANK
5.2%
UNEMPLOYMENT AMONG AGES 65 TO 74 YEARS
95.6/ 100
METRIC RATING
103rd/ 347
METRIC RANK
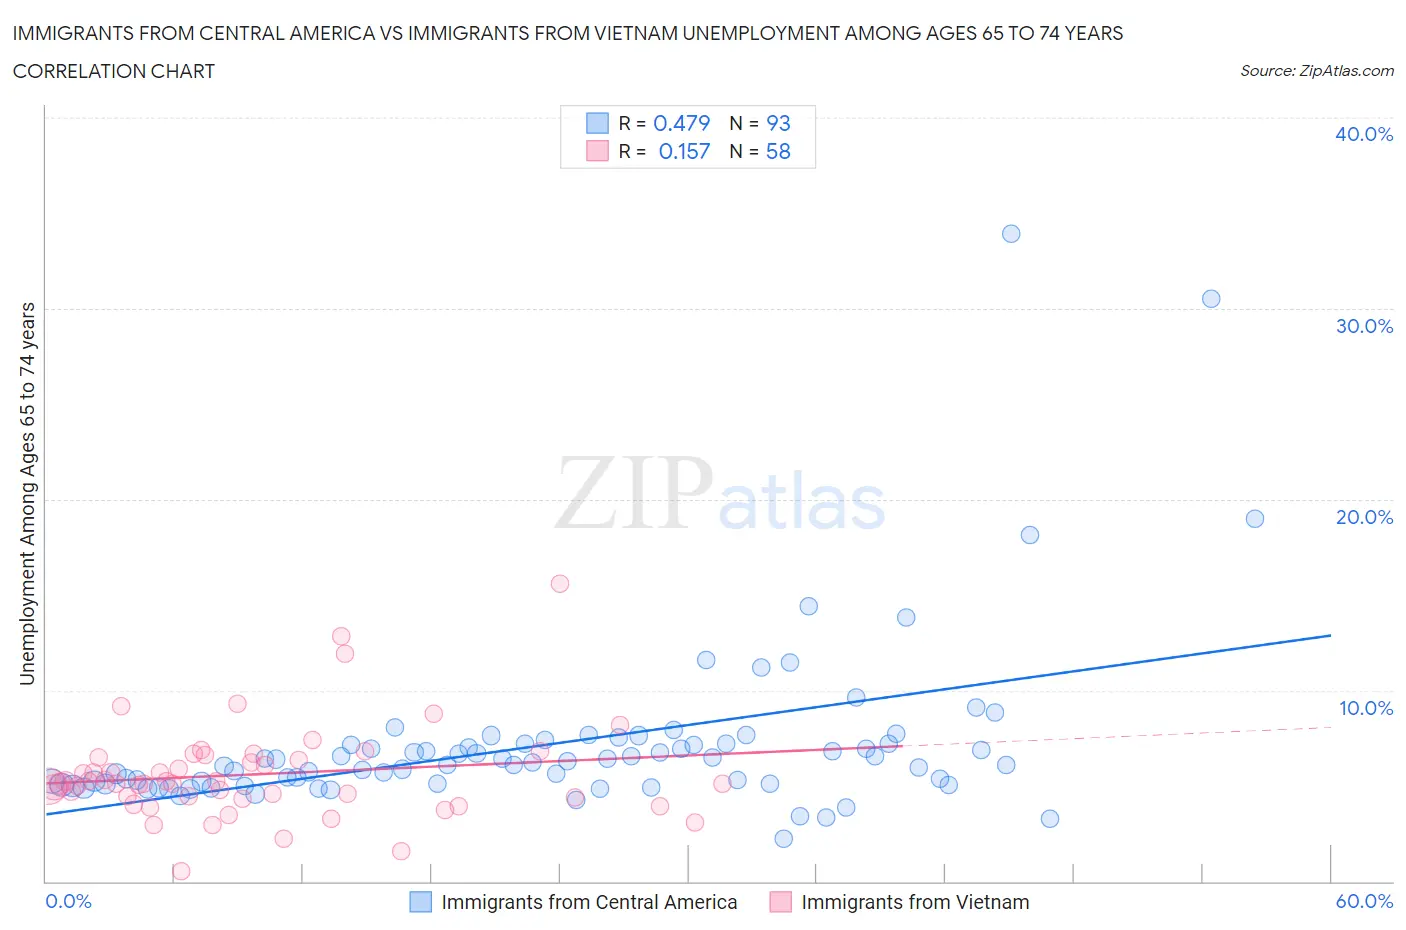
Immigrants from Central America vs Immigrants from Vietnam Unemployment Among Ages 65 to 74 years Correlation Chart
The statistical analysis conducted on geographies consisting of 432,316,181 people shows a moderate positive correlation between the proportion of Immigrants from Central America and unemployment rate among population between the ages 65 and 74 in the United States with a correlation coefficient (R) of 0.479 and weighted average of 5.9%. Similarly, the statistical analysis conducted on geographies consisting of 357,766,135 people shows a poor positive correlation between the proportion of Immigrants from Vietnam and unemployment rate among population between the ages 65 and 74 in the United States with a correlation coefficient (R) of 0.157 and weighted average of 5.2%, a difference of 13.3%.
Unemployment Among Ages 65 to 74 years Correlation Summary
| Measurement | Immigrants from Central America | Immigrants from Vietnam |
| Minimum | 2.2% | 0.50% |
| Maximum | 33.9% | 15.6% |
| Range | 31.7% | 15.1% |
| Mean | 7.2% | 5.6% |
| Median | 6.2% | 5.1% |
| Interquartile 25% (IQ1) | 5.1% | 4.4% |
| Interquartile 75% (IQ3) | 7.2% | 6.5% |
| Interquartile Range (IQR) | 2.1% | 2.1% |
| Standard Deviation (Sample) | 4.6% | 2.5% |
| Standard Deviation (Population) | 4.6% | 2.5% |
Similar Demographics by Unemployment Among Ages 65 to 74 years
Demographics Similar to Immigrants from Central America by Unemployment Among Ages 65 to 74 years
In terms of unemployment among ages 65 to 74 years, the demographic groups most similar to Immigrants from Central America are Zimbabwean (5.9%, a difference of 0.27%), Aleut (5.9%, a difference of 0.29%), Immigrants from Bahamas (5.9%, a difference of 0.38%), Immigrants from El Salvador (5.9%, a difference of 0.49%), and Immigrants from Dominica (6.0%, a difference of 0.75%).
| Demographics | Rating | Rank | Unemployment Among Ages 65 to 74 years |
| Immigrants | Bangladesh | 0.0 /100 | #310 | Tragic 5.9% |
| Venezuelans | 0.0 /100 | #311 | Tragic 5.9% |
| Hispanics or Latinos | 0.0 /100 | #312 | Tragic 5.9% |
| Vietnamese | 0.0 /100 | #313 | Tragic 5.9% |
| Immigrants | Venezuela | 0.0 /100 | #314 | Tragic 5.9% |
| Immigrants | Guatemala | 0.0 /100 | #315 | Tragic 5.9% |
| Immigrants | El Salvador | 0.0 /100 | #316 | Tragic 5.9% |
| Immigrants | Central America | 0.0 /100 | #317 | Tragic 5.9% |
| Zimbabweans | 0.0 /100 | #318 | Tragic 5.9% |
| Aleuts | 0.0 /100 | #319 | Tragic 5.9% |
| Immigrants | Bahamas | 0.0 /100 | #320 | Tragic 5.9% |
| Immigrants | Dominica | 0.0 /100 | #321 | Tragic 6.0% |
| Immigrants | Mexico | 0.0 /100 | #322 | Tragic 6.0% |
| Delaware | 0.0 /100 | #323 | Tragic 6.0% |
| Tohono O'odham | 0.0 /100 | #324 | Tragic 6.0% |
Demographics Similar to Immigrants from Vietnam by Unemployment Among Ages 65 to 74 years
In terms of unemployment among ages 65 to 74 years, the demographic groups most similar to Immigrants from Vietnam are Yugoslavian (5.2%, a difference of 0.020%), Immigrants from Lithuania (5.2%, a difference of 0.070%), Iranian (5.2%, a difference of 0.070%), Malaysian (5.2%, a difference of 0.090%), and Japanese (5.2%, a difference of 0.17%).
| Demographics | Rating | Rank | Unemployment Among Ages 65 to 74 years |
| Immigrants | Thailand | 97.0 /100 | #96 | Exceptional 5.2% |
| Senegalese | 96.5 /100 | #97 | Exceptional 5.2% |
| Welsh | 96.5 /100 | #98 | Exceptional 5.2% |
| Burmese | 96.4 /100 | #99 | Exceptional 5.2% |
| Japanese | 96.4 /100 | #100 | Exceptional 5.2% |
| Immigrants | Cambodia | 96.3 /100 | #101 | Exceptional 5.2% |
| Immigrants | Lithuania | 95.9 /100 | #102 | Exceptional 5.2% |
| Immigrants | Vietnam | 95.6 /100 | #103 | Exceptional 5.2% |
| Yugoslavians | 95.5 /100 | #104 | Exceptional 5.2% |
| Iranians | 95.2 /100 | #105 | Exceptional 5.2% |
| Malaysians | 95.1 /100 | #106 | Exceptional 5.2% |
| Austrians | 94.5 /100 | #107 | Exceptional 5.2% |
| Immigrants | Malaysia | 94.1 /100 | #108 | Exceptional 5.2% |
| Immigrants | Singapore | 93.9 /100 | #109 | Exceptional 5.2% |
| Immigrants | Bolivia | 93.6 /100 | #110 | Exceptional 5.2% |