Immigrants from Central America vs Belizean Unemployment Among Ages 55 to 59 years
COMPARE
Immigrants from Central America
Belizean
Unemployment Among Ages 55 to 59 years
Unemployment Among Ages 55 to 59 years Comparison
Immigrants from Central America
Belizeans
5.3%
UNEMPLOYMENT AMONG AGES 55 TO 59 YEARS
0.0/ 100
METRIC RATING
289th/ 347
METRIC RANK
5.6%
UNEMPLOYMENT AMONG AGES 55 TO 59 YEARS
0.0/ 100
METRIC RATING
310th/ 347
METRIC RANK
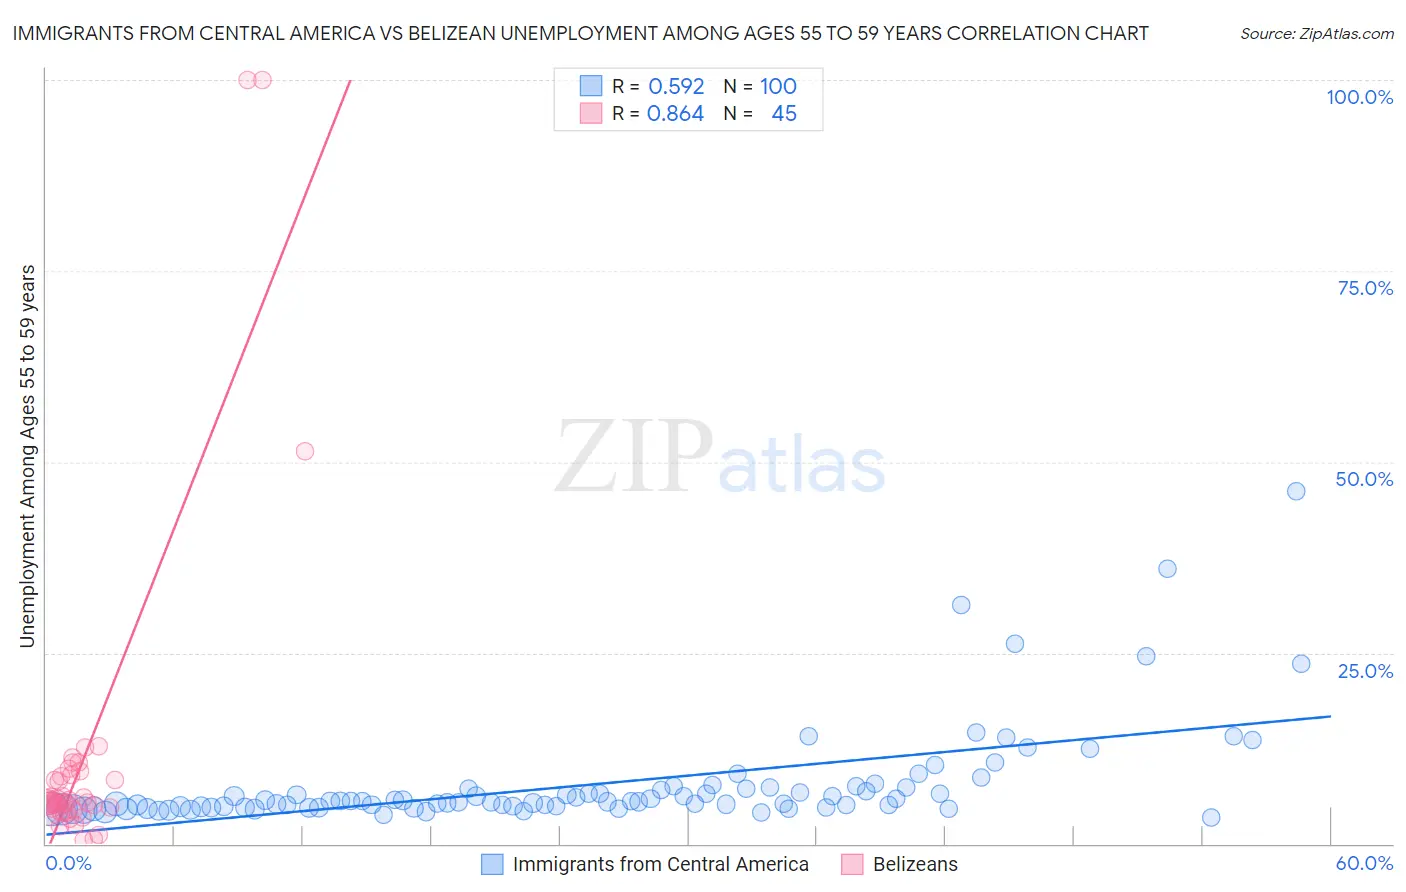
Immigrants from Central America vs Belizean Unemployment Among Ages 55 to 59 years Correlation Chart
The statistical analysis conducted on geographies consisting of 469,763,743 people shows a substantial positive correlation between the proportion of Immigrants from Central America and unemployment rate among population between the ages 55 and 59 in the United States with a correlation coefficient (R) of 0.592 and weighted average of 5.3%. Similarly, the statistical analysis conducted on geographies consisting of 141,169,321 people shows a very strong positive correlation between the proportion of Belizeans and unemployment rate among population between the ages 55 and 59 in the United States with a correlation coefficient (R) of 0.864 and weighted average of 5.6%, a difference of 6.0%.
Unemployment Among Ages 55 to 59 years Correlation Summary
| Measurement | Immigrants from Central America | Belizean |
| Minimum | 3.5% | 0.57% |
| Maximum | 46.2% | 100.0% |
| Range | 42.7% | 99.4% |
| Mean | 7.8% | 11.2% |
| Median | 5.5% | 5.5% |
| Interquartile 25% (IQ1) | 4.7% | 4.5% |
| Interquartile 75% (IQ3) | 7.2% | 8.9% |
| Interquartile Range (IQR) | 2.5% | 4.3% |
| Standard Deviation (Sample) | 6.7% | 20.7% |
| Standard Deviation (Population) | 6.7% | 20.5% |
Similar Demographics by Unemployment Among Ages 55 to 59 years
Demographics Similar to Immigrants from Central America by Unemployment Among Ages 55 to 59 years
In terms of unemployment among ages 55 to 59 years, the demographic groups most similar to Immigrants from Central America are Sioux (5.3%, a difference of 0.030%), Immigrants from Israel (5.3%, a difference of 0.060%), Immigrants from Guatemala (5.3%, a difference of 0.070%), Immigrants from Ghana (5.3%, a difference of 0.090%), and Trinidadian and Tobagonian (5.3%, a difference of 0.10%).
| Demographics | Rating | Rank | Unemployment Among Ages 55 to 59 years |
| Immigrants | Trinidad and Tobago | 0.0 /100 | #282 | Tragic 5.3% |
| Apache | 0.0 /100 | #283 | Tragic 5.3% |
| Ghanaians | 0.0 /100 | #284 | Tragic 5.3% |
| Armenians | 0.0 /100 | #285 | Tragic 5.3% |
| Immigrants | Ghana | 0.0 /100 | #286 | Tragic 5.3% |
| Immigrants | Guatemala | 0.0 /100 | #287 | Tragic 5.3% |
| Immigrants | Israel | 0.0 /100 | #288 | Tragic 5.3% |
| Immigrants | Central America | 0.0 /100 | #289 | Tragic 5.3% |
| Sioux | 0.0 /100 | #290 | Tragic 5.3% |
| Trinidadians and Tobagonians | 0.0 /100 | #291 | Tragic 5.3% |
| British West Indians | 0.0 /100 | #292 | Tragic 5.3% |
| Immigrants | Grenada | 0.0 /100 | #293 | Tragic 5.3% |
| Cajuns | 0.0 /100 | #294 | Tragic 5.3% |
| Dutch West Indians | 0.0 /100 | #295 | Tragic 5.3% |
| Barbadians | 0.0 /100 | #296 | Tragic 5.3% |
Demographics Similar to Belizeans by Unemployment Among Ages 55 to 59 years
In terms of unemployment among ages 55 to 59 years, the demographic groups most similar to Belizeans are Houma (5.6%, a difference of 0.18%), Ecuadorian (5.6%, a difference of 0.39%), Nepalese (5.6%, a difference of 0.44%), Central American Indian (5.6%, a difference of 0.58%), and Tlingit-Haida (5.7%, a difference of 0.87%).
| Demographics | Rating | Rank | Unemployment Among Ages 55 to 59 years |
| Marshallese | 0.0 /100 | #303 | Tragic 5.5% |
| Blacks/African Americans | 0.0 /100 | #304 | Tragic 5.5% |
| Immigrants | Portugal | 0.0 /100 | #305 | Tragic 5.5% |
| Immigrants | Cabo Verde | 0.0 /100 | #306 | Tragic 5.5% |
| Immigrants | Belize | 0.0 /100 | #307 | Tragic 5.5% |
| Spanish American Indians | 0.0 /100 | #308 | Tragic 5.6% |
| Nepalese | 0.0 /100 | #309 | Tragic 5.6% |
| Belizeans | 0.0 /100 | #310 | Tragic 5.6% |
| Houma | 0.0 /100 | #311 | Tragic 5.6% |
| Ecuadorians | 0.0 /100 | #312 | Tragic 5.6% |
| Central American Indians | 0.0 /100 | #313 | Tragic 5.6% |
| Tlingit-Haida | 0.0 /100 | #314 | Tragic 5.7% |
| Guyanese | 0.0 /100 | #315 | Tragic 5.7% |
| Immigrants | Ecuador | 0.0 /100 | #316 | Tragic 5.7% |
| Hmong | 0.0 /100 | #317 | Tragic 5.7% |