Immigrants from Canada vs Paiute Unemployment Among Seniors over 65 years
COMPARE
Immigrants from Canada
Paiute
Unemployment Among Seniors over 65 years
Unemployment Among Seniors over 65 years Comparison
Immigrants from Canada
Paiute
5.1%
UNEMPLOYMENT AMONG SENIORS OVER 65 YEARS
89.7/ 100
METRIC RATING
119th/ 347
METRIC RANK
6.3%
UNEMPLOYMENT AMONG SENIORS OVER 65 YEARS
0.0/ 100
METRIC RATING
339th/ 347
METRIC RANK
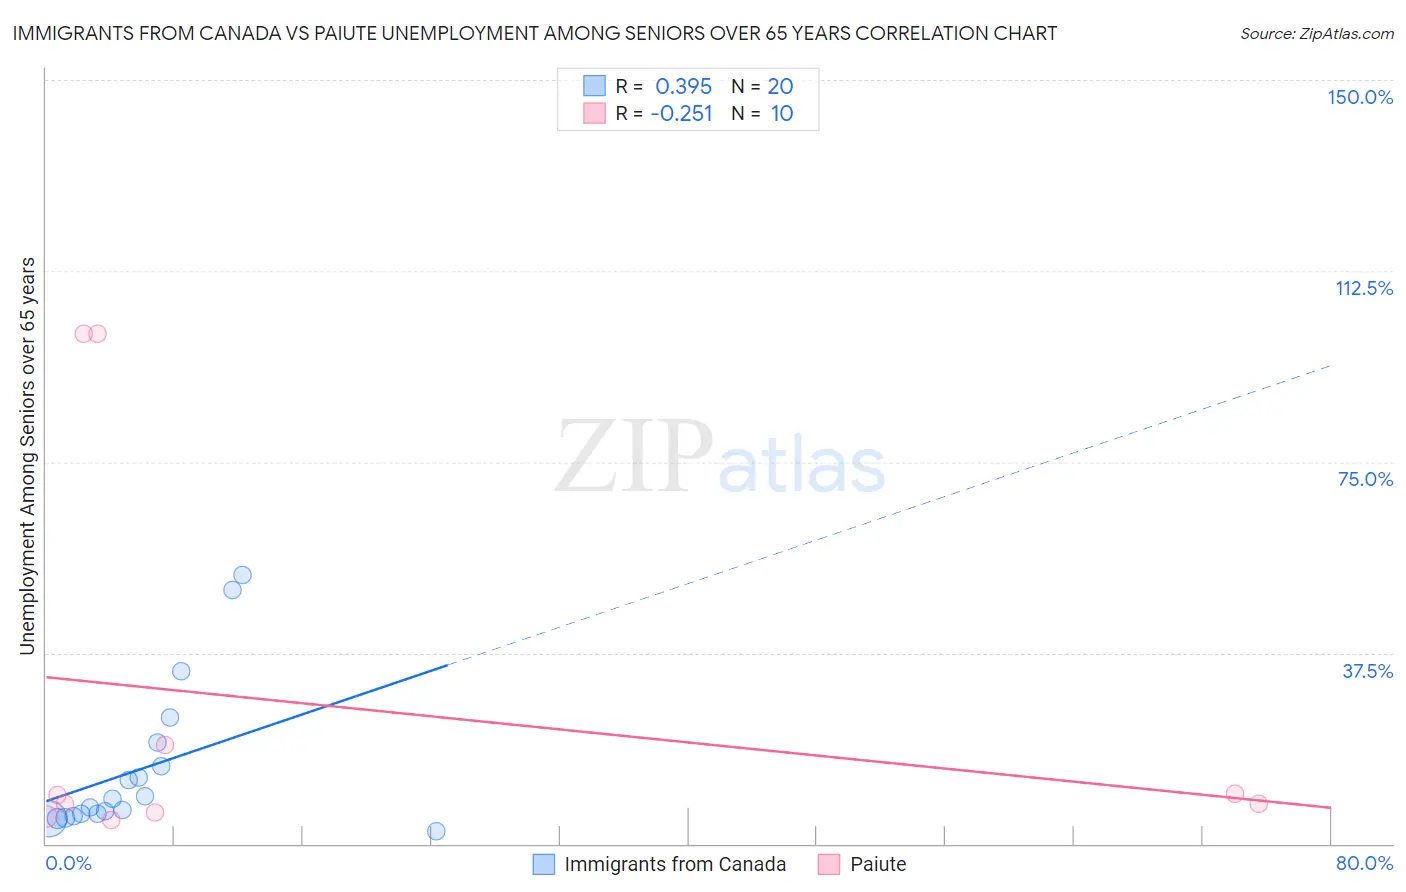
Immigrants from Canada vs Paiute Unemployment Among Seniors over 65 years Correlation Chart
The statistical analysis conducted on geographies consisting of 402,028,604 people shows a mild positive correlation between the proportion of Immigrants from Canada and unemployment rate amomg seniors over the age of 65 in the United States with a correlation coefficient (R) of 0.395 and weighted average of 5.1%. Similarly, the statistical analysis conducted on geographies consisting of 56,841,036 people shows a weak negative correlation between the proportion of Paiute and unemployment rate amomg seniors over the age of 65 in the United States with a correlation coefficient (R) of -0.251 and weighted average of 6.3%, a difference of 25.1%.
Unemployment Among Seniors over 65 years Correlation Summary
| Measurement | Immigrants from Canada | Paiute |
| Minimum | 2.5% | 4.8% |
| Maximum | 52.9% | 100.1% |
| Range | 50.4% | 95.3% |
| Mean | 14.8% | 27.1% |
| Median | 8.0% | 8.7% |
| Interquartile 25% (IQ1) | 5.7% | 6.1% |
| Interquartile 75% (IQ3) | 17.6% | 19.3% |
| Interquartile Range (IQR) | 11.9% | 13.2% |
| Standard Deviation (Sample) | 14.7% | 38.7% |
| Standard Deviation (Population) | 14.4% | 36.7% |
Similar Demographics by Unemployment Among Seniors over 65 years
Demographics Similar to Immigrants from Canada by Unemployment Among Seniors over 65 years
In terms of unemployment among seniors over 65 years, the demographic groups most similar to Immigrants from Canada are Soviet Union (5.1%, a difference of 0.040%), Malaysian (5.1%, a difference of 0.070%), Irish (5.1%, a difference of 0.080%), Puget Sound Salish (5.1%, a difference of 0.090%), and Immigrants from Cameroon (5.1%, a difference of 0.090%).
| Demographics | Rating | Rank | Unemployment Among Seniors over 65 years |
| Eastern Europeans | 92.0 /100 | #112 | Exceptional 5.0% |
| Seminole | 91.4 /100 | #113 | Exceptional 5.0% |
| Immigrants | Latvia | 91.4 /100 | #114 | Exceptional 5.0% |
| Celtics | 91.3 /100 | #115 | Exceptional 5.0% |
| Immigrants | Korea | 91.0 /100 | #116 | Exceptional 5.0% |
| Malaysians | 90.4 /100 | #117 | Exceptional 5.1% |
| Soviet Union | 90.1 /100 | #118 | Exceptional 5.1% |
| Immigrants | Canada | 89.7 /100 | #119 | Excellent 5.1% |
| Irish | 88.8 /100 | #120 | Excellent 5.1% |
| Puget Sound Salish | 88.7 /100 | #121 | Excellent 5.1% |
| Immigrants | Cameroon | 88.6 /100 | #122 | Excellent 5.1% |
| Asians | 88.5 /100 | #123 | Excellent 5.1% |
| Immigrants | North America | 87.9 /100 | #124 | Excellent 5.1% |
| Dutch | 87.6 /100 | #125 | Excellent 5.1% |
| Immigrants | Sri Lanka | 87.4 /100 | #126 | Excellent 5.1% |
Demographics Similar to Paiute by Unemployment Among Seniors over 65 years
In terms of unemployment among seniors over 65 years, the demographic groups most similar to Paiute are Ute (6.3%, a difference of 0.060%), Immigrants from the Azores (6.3%, a difference of 0.27%), Alaska Native (6.3%, a difference of 0.44%), Pima (6.3%, a difference of 0.99%), and Immigrants from Armenia (6.2%, a difference of 2.8%).
| Demographics | Rating | Rank | Unemployment Among Seniors over 65 years |
| Aleuts | 0.0 /100 | #332 | Tragic 6.0% |
| Immigrants | Dominican Republic | 0.0 /100 | #333 | Tragic 6.0% |
| Tohono O'odham | 0.0 /100 | #334 | Tragic 6.1% |
| Immigrants | Armenia | 0.0 /100 | #335 | Tragic 6.2% |
| Pima | 0.0 /100 | #336 | Tragic 6.3% |
| Alaska Natives | 0.0 /100 | #337 | Tragic 6.3% |
| Immigrants | Azores | 0.0 /100 | #338 | Tragic 6.3% |
| Paiute | 0.0 /100 | #339 | Tragic 6.3% |
| Ute | 0.0 /100 | #340 | Tragic 6.3% |
| Yakama | 0.0 /100 | #341 | Tragic 6.7% |
| Navajo | 0.0 /100 | #342 | Tragic 6.7% |
| Tlingit-Haida | 0.0 /100 | #343 | Tragic 6.8% |
| Alaskan Athabascans | 0.0 /100 | #344 | Tragic 7.0% |
| Immigrants | Yemen | 0.0 /100 | #345 | Tragic 8.2% |
| Yup'ik | 0.0 /100 | #346 | Tragic 9.1% |