Immigrants from Cameroon vs South American Indian Unemployment Among Ages 30 to 34 years
COMPARE
Immigrants from Cameroon
South American Indian
Unemployment Among Ages 30 to 34 years
Unemployment Among Ages 30 to 34 years Comparison
Immigrants from Cameroon
South American Indians
5.6%
UNEMPLOYMENT AMONG AGES 30 TO 34 YEARS
18.4/ 100
METRIC RATING
204th/ 347
METRIC RANK
5.6%
UNEMPLOYMENT AMONG AGES 30 TO 34 YEARS
24.4/ 100
METRIC RATING
201st/ 347
METRIC RANK
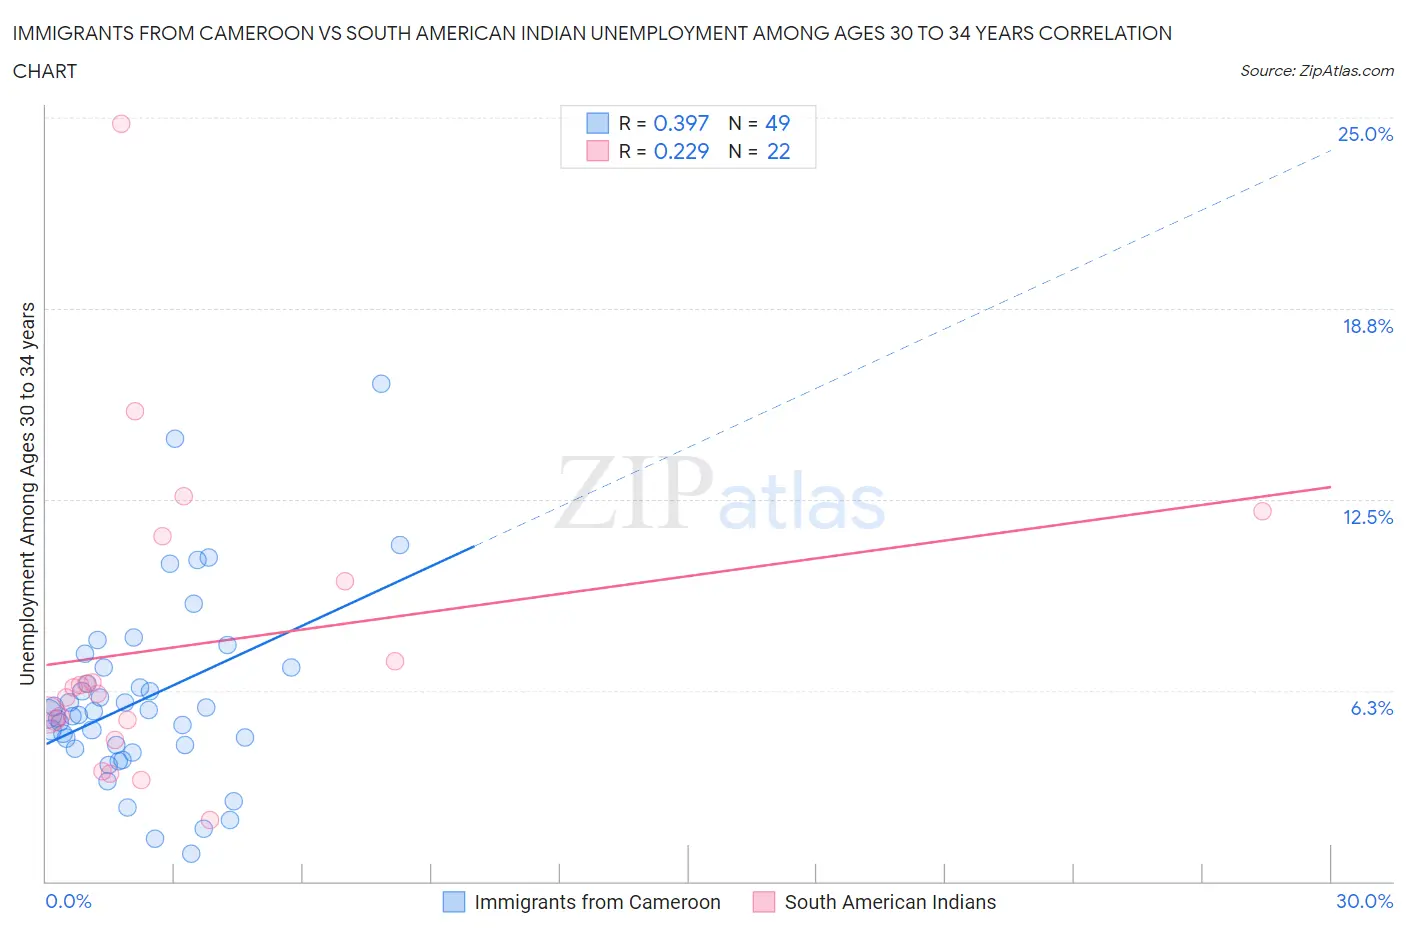
Immigrants from Cameroon vs South American Indian Unemployment Among Ages 30 to 34 years Correlation Chart
The statistical analysis conducted on geographies consisting of 128,849,811 people shows a mild positive correlation between the proportion of Immigrants from Cameroon and unemployment rate among population between the ages 30 and 34 in the United States with a correlation coefficient (R) of 0.397 and weighted average of 5.6%. Similarly, the statistical analysis conducted on geographies consisting of 161,720,998 people shows a weak positive correlation between the proportion of South American Indians and unemployment rate among population between the ages 30 and 34 in the United States with a correlation coefficient (R) of 0.229 and weighted average of 5.6%, a difference of 0.61%.
Unemployment Among Ages 30 to 34 years Correlation Summary
| Measurement | Immigrants from Cameroon | South American Indian |
| Minimum | 0.90% | 2.0% |
| Maximum | 16.3% | 24.8% |
| Range | 15.4% | 22.8% |
| Mean | 6.0% | 7.7% |
| Median | 5.5% | 6.2% |
| Interquartile 25% (IQ1) | 4.4% | 5.3% |
| Interquartile 75% (IQ3) | 7.0% | 9.8% |
| Interquartile Range (IQR) | 2.6% | 4.5% |
| Standard Deviation (Sample) | 3.0% | 5.1% |
| Standard Deviation (Population) | 3.0% | 5.0% |
Demographics Similar to Immigrants from Cameroon and South American Indians by Unemployment Among Ages 30 to 34 years
In terms of unemployment among ages 30 to 34 years, the demographic groups most similar to Immigrants from Cameroon are Korean (5.6%, a difference of 0.25%), Immigrants from Germany (5.6%, a difference of 0.47%), Immigrants from Costa Rica (5.6%, a difference of 0.49%), Alsatian (5.6%, a difference of 0.50%), and Israeli (5.6%, a difference of 0.72%). Similarly, the demographic groups most similar to South American Indians are Immigrants from Southern Europe (5.6%, a difference of 0.13%), Immigrants from Germany (5.6%, a difference of 0.14%), Nicaraguan (5.6%, a difference of 0.20%), Immigrants from Afghanistan (5.6%, a difference of 0.25%), and Korean (5.6%, a difference of 0.36%).
| Demographics | Rating | Rank | Unemployment Among Ages 30 to 34 years |
| Moroccans | 31.2 /100 | #192 | Fair 5.5% |
| Immigrants | Africa | 31.0 /100 | #193 | Fair 5.5% |
| Slavs | 30.9 /100 | #194 | Fair 5.5% |
| Finns | 30.7 /100 | #195 | Fair 5.5% |
| Immigrants | South America | 29.8 /100 | #196 | Fair 5.5% |
| Immigrants | Nicaragua | 28.9 /100 | #197 | Fair 5.5% |
| Immigrants | Afghanistan | 27.2 /100 | #198 | Fair 5.6% |
| Nicaraguans | 26.6 /100 | #199 | Fair 5.6% |
| Immigrants | Southern Europe | 25.8 /100 | #200 | Fair 5.6% |
| South American Indians | 24.4 /100 | #201 | Fair 5.6% |
| Immigrants | Germany | 22.9 /100 | #202 | Fair 5.6% |
| Koreans | 20.7 /100 | #203 | Fair 5.6% |
| Immigrants | Cameroon | 18.4 /100 | #204 | Poor 5.6% |
| Immigrants | Costa Rica | 14.4 /100 | #205 | Poor 5.6% |
| Alsatians | 14.3 /100 | #206 | Poor 5.6% |
| Israelis | 12.8 /100 | #207 | Poor 5.6% |
| Immigrants | Philippines | 11.5 /100 | #208 | Poor 5.7% |
| French | 10.8 /100 | #209 | Poor 5.7% |
| Whites/Caucasians | 9.2 /100 | #210 | Tragic 5.7% |
| Spanish American Indians | 8.7 /100 | #211 | Tragic 5.7% |
| Scotch-Irish | 8.6 /100 | #212 | Tragic 5.7% |