Immigrants from Cameroon vs Immigrants from Uganda Male Unemployment
COMPARE
Immigrants from Cameroon
Immigrants from Uganda
Male Unemployment
Male Unemployment Comparison
Immigrants from Cameroon
Immigrants from Uganda
5.6%
MALE UNEMPLOYMENT
1.0/ 100
METRIC RATING
240th/ 347
METRIC RANK
5.4%
MALE UNEMPLOYMENT
28.8/ 100
METRIC RATING
190th/ 347
METRIC RANK
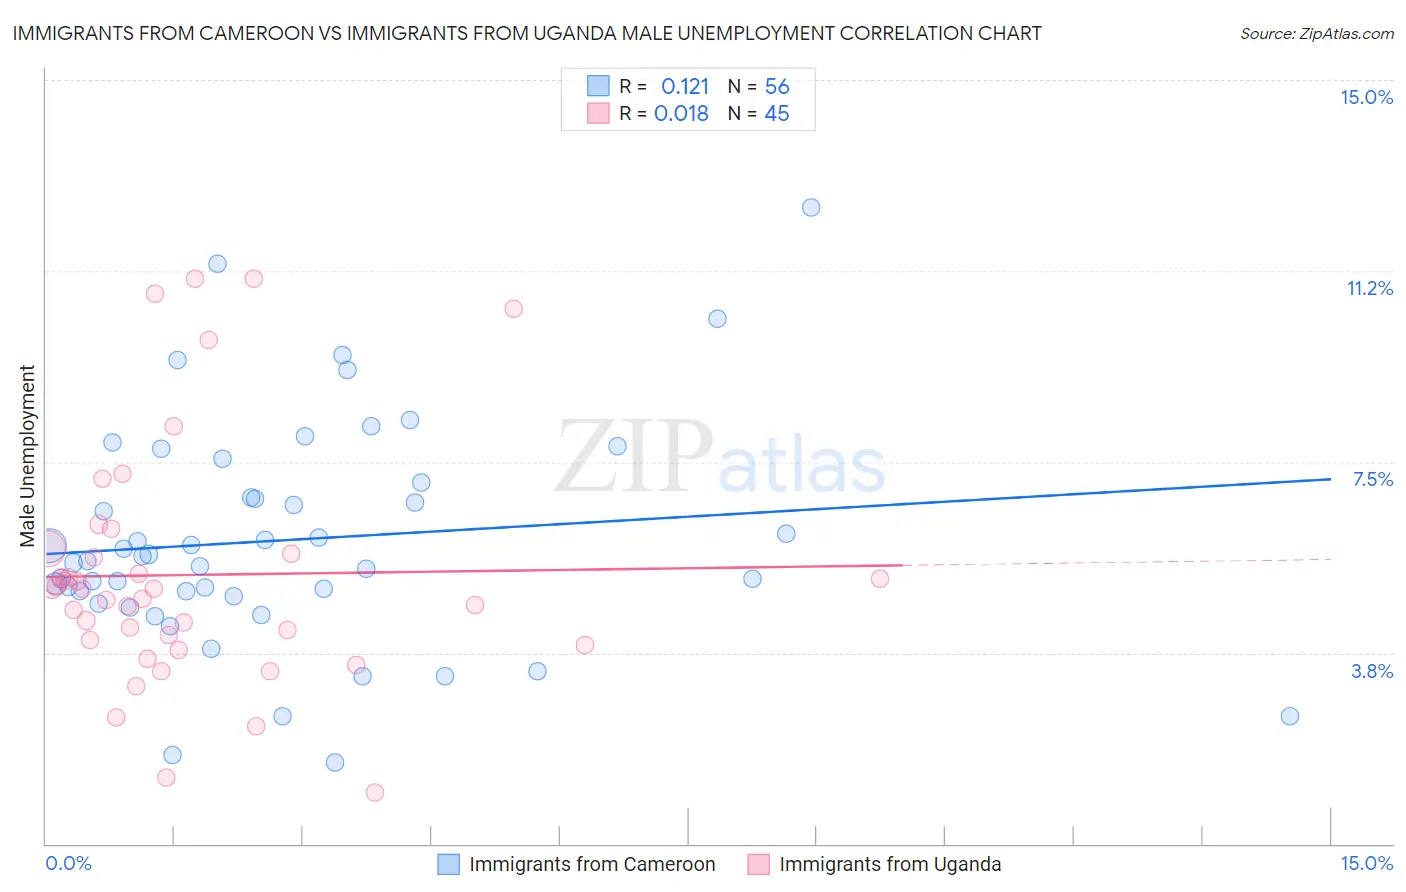
Immigrants from Cameroon vs Immigrants from Uganda Male Unemployment Correlation Chart
The statistical analysis conducted on geographies consisting of 130,586,445 people shows a poor positive correlation between the proportion of Immigrants from Cameroon and unemployment rate among males in the United States with a correlation coefficient (R) of 0.121 and weighted average of 5.6%. Similarly, the statistical analysis conducted on geographies consisting of 125,897,340 people shows no correlation between the proportion of Immigrants from Uganda and unemployment rate among males in the United States with a correlation coefficient (R) of 0.018 and weighted average of 5.4%, a difference of 5.3%.
Male Unemployment Correlation Summary
| Measurement | Immigrants from Cameroon | Immigrants from Uganda |
| Minimum | 1.6% | 1.0% |
| Maximum | 12.5% | 11.1% |
| Range | 10.9% | 10.1% |
| Mean | 6.0% | 5.3% |
| Median | 5.6% | 5.0% |
| Interquartile 25% (IQ1) | 4.9% | 4.0% |
| Interquartile 75% (IQ3) | 7.0% | 5.7% |
| Interquartile Range (IQR) | 2.0% | 1.8% |
| Standard Deviation (Sample) | 2.2% | 2.4% |
| Standard Deviation (Population) | 2.2% | 2.3% |
Similar Demographics by Male Unemployment
Demographics Similar to Immigrants from Cameroon by Male Unemployment
In terms of male unemployment, the demographic groups most similar to Immigrants from Cameroon are Salvadoran (5.7%, a difference of 0.040%), Native Hawaiian (5.6%, a difference of 0.070%), Immigrants from Guatemala (5.6%, a difference of 0.070%), Ottawa (5.7%, a difference of 0.11%), and Honduran (5.6%, a difference of 0.12%).
| Demographics | Rating | Rank | Male Unemployment |
| Somalis | 1.5 /100 | #233 | Tragic 5.6% |
| Immigrants | Somalia | 1.5 /100 | #234 | Tragic 5.6% |
| Immigrants | Honduras | 1.5 /100 | #235 | Tragic 5.6% |
| Guatemalans | 1.2 /100 | #236 | Tragic 5.6% |
| Hondurans | 1.1 /100 | #237 | Tragic 5.6% |
| Native Hawaiians | 1.1 /100 | #238 | Tragic 5.6% |
| Immigrants | Guatemala | 1.1 /100 | #239 | Tragic 5.6% |
| Immigrants | Cameroon | 1.0 /100 | #240 | Tragic 5.6% |
| Salvadorans | 1.0 /100 | #241 | Tragic 5.7% |
| Ottawa | 0.9 /100 | #242 | Tragic 5.7% |
| Bangladeshis | 0.8 /100 | #243 | Tragic 5.7% |
| Immigrants | El Salvador | 0.7 /100 | #244 | Tragic 5.7% |
| Yaqui | 0.7 /100 | #245 | Tragic 5.7% |
| Iroquois | 0.6 /100 | #246 | Tragic 5.7% |
| Hawaiians | 0.6 /100 | #247 | Tragic 5.7% |
Demographics Similar to Immigrants from Uganda by Male Unemployment
In terms of male unemployment, the demographic groups most similar to Immigrants from Uganda are Immigrants from South America (5.4%, a difference of 0.040%), Immigrants from South Eastern Asia (5.4%, a difference of 0.040%), Arab (5.4%, a difference of 0.10%), Costa Rican (5.4%, a difference of 0.18%), and Iraqi (5.4%, a difference of 0.19%).
| Demographics | Rating | Rank | Male Unemployment |
| Taiwanese | 37.6 /100 | #183 | Fair 5.3% |
| Spaniards | 35.1 /100 | #184 | Fair 5.3% |
| Koreans | 34.9 /100 | #185 | Fair 5.3% |
| Iraqis | 31.6 /100 | #186 | Fair 5.4% |
| Costa Ricans | 31.3 /100 | #187 | Fair 5.4% |
| Arabs | 30.2 /100 | #188 | Fair 5.4% |
| Immigrants | South America | 29.4 /100 | #189 | Fair 5.4% |
| Immigrants | Uganda | 28.8 /100 | #190 | Fair 5.4% |
| Immigrants | South Eastern Asia | 28.2 /100 | #191 | Fair 5.4% |
| Immigrants | Belarus | 26.0 /100 | #192 | Fair 5.4% |
| Immigrants | Israel | 25.2 /100 | #193 | Fair 5.4% |
| Spanish | 19.7 /100 | #194 | Poor 5.4% |
| Immigrants | Southern Europe | 17.7 /100 | #195 | Poor 5.4% |
| Albanians | 17.3 /100 | #196 | Poor 5.4% |
| Alsatians | 16.7 /100 | #197 | Poor 5.4% |