Immigrants from Cambodia vs Polish Female Unemployment
COMPARE
Immigrants from Cambodia
Polish
Female Unemployment
Female Unemployment Comparison
Immigrants from Cambodia
Poles
5.5%
FEMALE UNEMPLOYMENT
3.3/ 100
METRIC RATING
236th/ 347
METRIC RANK
4.7%
FEMALE UNEMPLOYMENT
99.9/ 100
METRIC RATING
19th/ 347
METRIC RANK
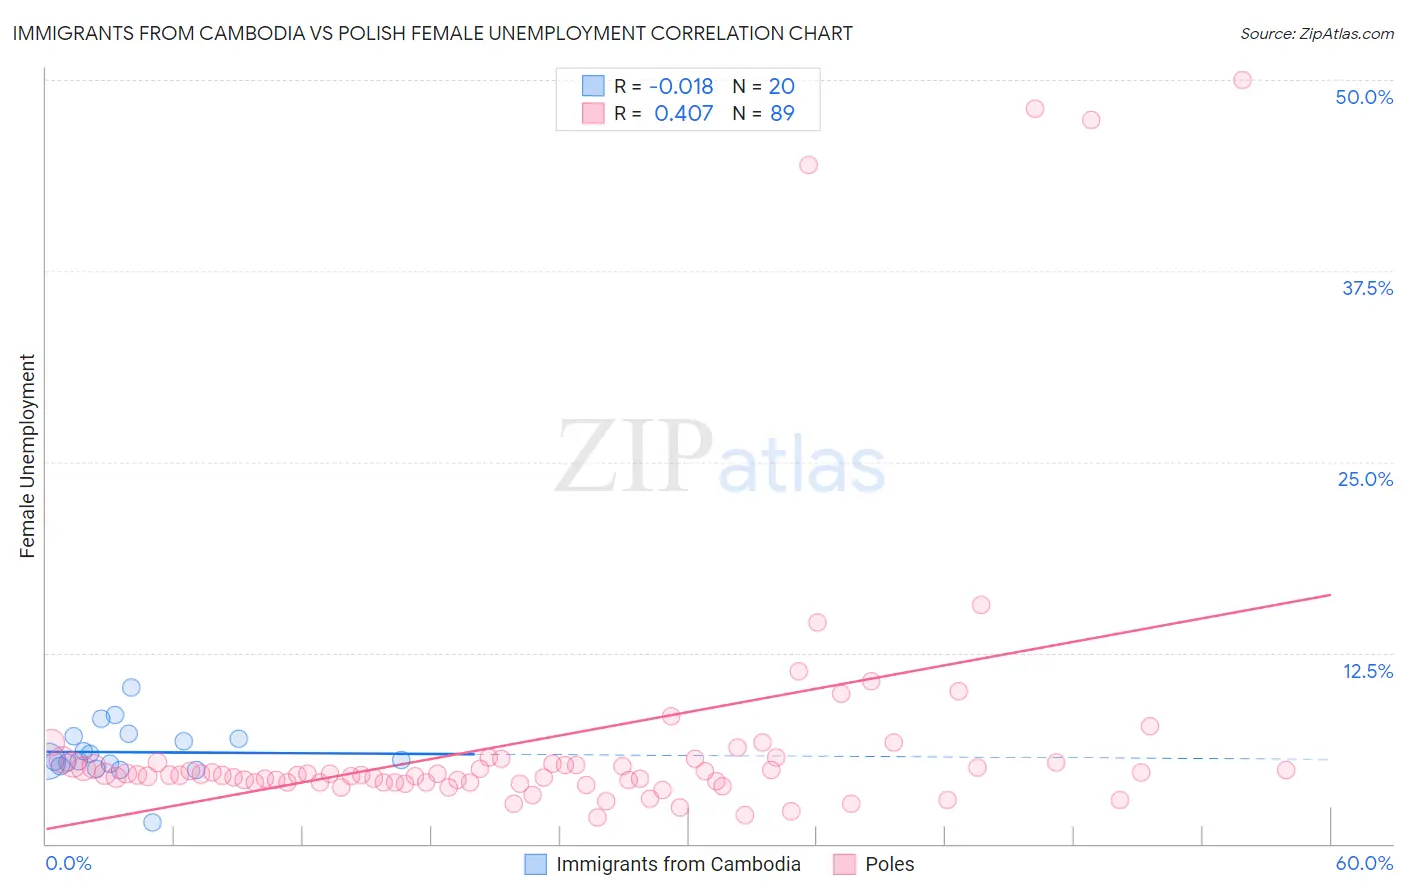
Immigrants from Cambodia vs Polish Female Unemployment Correlation Chart
The statistical analysis conducted on geographies consisting of 204,858,353 people shows no correlation between the proportion of Immigrants from Cambodia and unemploymnet rate among females in the United States with a correlation coefficient (R) of -0.018 and weighted average of 5.5%. Similarly, the statistical analysis conducted on geographies consisting of 548,133,946 people shows a moderate positive correlation between the proportion of Poles and unemploymnet rate among females in the United States with a correlation coefficient (R) of 0.407 and weighted average of 4.7%, a difference of 18.0%.
Female Unemployment Correlation Summary
| Measurement | Immigrants from Cambodia | Polish |
| Minimum | 1.4% | 1.7% |
| Maximum | 10.2% | 50.0% |
| Range | 8.8% | 48.3% |
| Mean | 6.0% | 6.9% |
| Median | 5.5% | 4.5% |
| Interquartile 25% (IQ1) | 5.2% | 4.0% |
| Interquartile 75% (IQ3) | 7.0% | 5.3% |
| Interquartile Range (IQR) | 1.8% | 1.3% |
| Standard Deviation (Sample) | 1.8% | 9.1% |
| Standard Deviation (Population) | 1.7% | 9.1% |
Similar Demographics by Female Unemployment
Demographics Similar to Immigrants from Cambodia by Female Unemployment
In terms of female unemployment, the demographic groups most similar to Immigrants from Cambodia are Immigrants from Panama (5.5%, a difference of 0.020%), Immigrants from Iran (5.5%, a difference of 0.030%), Immigrants from Lebanon (5.5%, a difference of 0.040%), Sierra Leonean (5.5%, a difference of 0.040%), and Moroccan (5.5%, a difference of 0.060%).
| Demographics | Rating | Rank | Female Unemployment |
| Panamanians | 4.7 /100 | #229 | Tragic 5.5% |
| Immigrants | Uruguay | 4.7 /100 | #230 | Tragic 5.5% |
| Immigrants | Iraq | 3.9 /100 | #231 | Tragic 5.5% |
| Liberians | 3.9 /100 | #232 | Tragic 5.5% |
| Moroccans | 3.4 /100 | #233 | Tragic 5.5% |
| Immigrants | Lebanon | 3.3 /100 | #234 | Tragic 5.5% |
| Immigrants | Iran | 3.3 /100 | #235 | Tragic 5.5% |
| Immigrants | Cambodia | 3.3 /100 | #236 | Tragic 5.5% |
| Immigrants | Panama | 3.2 /100 | #237 | Tragic 5.5% |
| Sierra Leoneans | 3.2 /100 | #238 | Tragic 5.5% |
| Aleuts | 3.0 /100 | #239 | Tragic 5.5% |
| Immigrants | South America | 2.9 /100 | #240 | Tragic 5.5% |
| South American Indians | 2.8 /100 | #241 | Tragic 5.5% |
| Marshallese | 2.3 /100 | #242 | Tragic 5.6% |
| Spanish Americans | 2.2 /100 | #243 | Tragic 5.6% |
Demographics Similar to Poles by Female Unemployment
In terms of female unemployment, the demographic groups most similar to Poles are Latvian (4.7%, a difference of 0.010%), Bulgarian (4.7%, a difference of 0.080%), Fijian (4.7%, a difference of 0.090%), European (4.7%, a difference of 0.11%), and Croatian (4.7%, a difference of 0.16%).
| Demographics | Rating | Rank | Female Unemployment |
| Dutch | 100.0 /100 | #12 | Exceptional 4.6% |
| Belgians | 100.0 /100 | #13 | Exceptional 4.6% |
| Finns | 100.0 /100 | #14 | Exceptional 4.6% |
| English | 100.0 /100 | #15 | Exceptional 4.6% |
| Carpatho Rusyns | 99.9 /100 | #16 | Exceptional 4.7% |
| Croatians | 99.9 /100 | #17 | Exceptional 4.7% |
| Latvians | 99.9 /100 | #18 | Exceptional 4.7% |
| Poles | 99.9 /100 | #19 | Exceptional 4.7% |
| Bulgarians | 99.9 /100 | #20 | Exceptional 4.7% |
| Fijians | 99.9 /100 | #21 | Exceptional 4.7% |
| Europeans | 99.9 /100 | #22 | Exceptional 4.7% |
| Scottish | 99.9 /100 | #23 | Exceptional 4.7% |
| Welsh | 99.9 /100 | #24 | Exceptional 4.7% |
| Immigrants | India | 99.9 /100 | #25 | Exceptional 4.7% |
| Immigrants | Bosnia and Herzegovina | 99.9 /100 | #26 | Exceptional 4.7% |